Journals >Journal of Atmospheric and Environmental Optics
Contents

2025
Volume: 20 Issue 1
10 Article(s)
Export citation format

Research progress of cloud classification based on optical satellite remote sensing
FU Yashuai, ZHANG Wenhao, JIN Yongtao, LIU Qiyue... and MA Yu|Show fewer author(s)
Cloud-type products have very important applications in many fields such as weather forecasting, climate change, disaster monitoring and early warning. In recent years, with the development of satellite technology, optical satellite remote sensing has become an important data source for cloud classification research duCloud-type products have very important applications in many fields such as weather forecasting, climate change, disaster monitoring and early warning. In recent years, with the development of satellite technology, optical satellite remote sensing has become an important data source for cloud classification research due to its advantages of wide spatial coverage, high observation frequency and high spatial resolution. At the same time, cloud classification based on optical satellite remote sensing has also achieved a series of research results. In this paper, optical remote sensing satellites and their sensors for cloud classification are briefly introduced firstly. Then, the research progress of cloud classification based on optical satellite remote sensing in China and abroad in the past 20 years is systematically expounded. According to the principle and complexity of methods, cloud classification methods are mainly divided into three types based on simple linear relationship, mathematical statistics and machine learning, respectively. Finally, the problems existing in the research of cloud classification based on optical satellite remote sensing are analyzed and the future research direction is prospected, which is expected to provide reference for the research and application of domestic satellite cloud classification..
Journal of Atmospheric and Environmental Optics
- Publication Date: Jan. 28, 2025
- Vol. 20, Issue 1, 1 (2025)


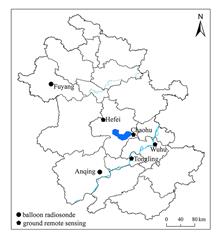
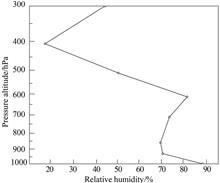
Comparison of vertical profiles between ERA5 reanalysis data and balloon radiosondes data in Anhui, China
DENG Xueliang, ZHU Song, HE Dongyan, SHEN Weiwei... and XU Qianqian|Show fewer author(s)
Based on the L-band balloon radiosondes data in Anhui Province, the main factors such as temperature, relative humidity and wind field of ERA5 reanalysis data, the 5th generation product of the European Centre for Medium-Range Weather Forecasts (ECMWF), from 2018 to 2021 are systematically evaluated using multi-elementBased on the L-band balloon radiosondes data in Anhui Province, the main factors such as temperature, relative humidity and wind field of ERA5 reanalysis data, the 5th generation product of the European Centre for Medium-Range Weather Forecasts (ECMWF), from 2018 to 2021 are systematically evaluated using multi-element fusion matching method, and then the applicability of ERA5 vertical elements in Anhui, China, is explored. The results show that the elements of ERA5 is consistent with those of balloon radiosondes very well, and the correlation ranging from high to low is temperature, wind and relative humidity. In the vertical direction, it seems that the contrast of each element is significantly different, with the temperature and relative humidity in the low layers being better than those in the high layers, while the wind field being the opposite. The temperature of ERA5 has the highest correlation with that of balloon radiosondes, with the overall correlation coefficient greater than 0.99. Meanwhile, there is a negative bias in temperature for the whole layer, with the absolute relative error concentrated within 30%. With the rising of the height, the negative temperature bias of ERA5 increases and the proportion of low absolute relative error decreases. The wind field of ERA5 also shows good correlation with that of balloon radiosondes, with the correlation coefficients of u and v components both greater than 0.95, the bias of -5–5 m/s, and the absolute relative error mostly within 50%. Similar to that of temperature, the correlation coefficient and the proportion of low absolute relative error of wind field increase obviously with the height, especially for the improvement of zonal wind. The relative humidity of ERA5 has a poor correlation with that of balloon radiosondes. Due to the joint influence of assimilated data and models, the correlation coefficient of relative humidity between ERA5 and radiosondes is low, the bias distribution range is wide and the concentration of absolute relative error is low, indicating the worst comparison effect. As for vertical direction, the humidity bias increases with the height, leading to the decrease of the proportion of low absolute relative error in high layers. In addition, it is shown that precipitation has a more obvious influence on relative humidity and wind field, but a weaker influence on temperature..
Journal of Atmospheric and Environmental Optics
- Publication Date: Jan. 28, 2025
- Vol. 20, Issue 1, 18 (2025)
Analysis of a strong convective weather process triggered by a gust front
SU Jifeng, WANG Hailong, LIU Yong, LI Shuai, and KANG Hanqing
Based on conventional observation data, National Centers for Environmental Prediction (NCEP) reanalysis data, Doppler weather radar and wind profile radar data, as well as secondary development product data, the weather process of thunderstorm gale and short-time heavy precipitation triggered by a gust front in Wuhu arBased on conventional observation data, National Centers for Environmental Prediction (NCEP) reanalysis data, Doppler weather radar and wind profile radar data, as well as secondary development product data, the weather process of thunderstorm gale and short-time heavy precipitation triggered by a gust front in Wuhu area, China, on July 19, 2021 was analyzed. The results show that: (1) The radial velocity field near the gust front has obvious convergence characteristics. When the gust front meets a favorable environmental field during its movement, it can trigger the formation of new thunderstorm cells. (2) The wind profile data products can reflect the vertical atmospheric motion before and after the passage of the gust front. There are weak rising and sinking motions at the same time in the atmosphere during the pre-frontal stage. In the early stage of the front, the sinking cold air of the thunderstorm parent causes the atmospheric subsidence to be the main movement, and the minimum height of the shear layer of wind field decreases first and then increases, and the thickness of the shear layer becomes thinner. During the transit and the post-frontal phases, there are both rising and sinking movements. (3) The signal-to-noise ratio (SNR) can directly reflect the beginning and end of precipitation and the changing characteristics of rain intensity during severe convective weather. As convective precipitation is affected by precipitation particles and turbulence, its SNR increases significantly 10 minutes before precipitation begins. After the beginning of precipitation, the SNR of convective precipitation is larger than that of stable precipitation, generally maintaining between 50 and 65 db, and between 55 and 70 db when the rain intensity is maximum. (4) The peak time of helicity (SRH), calculated by the secondary development of wind profile data, is 1–2 hours earlier than that of rain intensity maximum, which can be used as a reference factor to predict the occurrence time of heavy precipitation..
Journal of Atmospheric and Environmental Optics
- Publication Date: Jan. 28, 2025
- Vol. 20, Issue 1, 34 (2025)
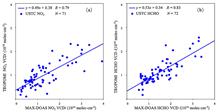
Analysis of tropospheric ozone characterization in Pearl River Delta region based on TROPOMI
YANG Kunpeng, LIU Haoran, XING Chengzhi, SU Wenjing... and LIU Cheng|Show fewer author(s)
Using the tropospheric monitoring instrument (TROPOMI) O3, NO2 and HCHO products developed by the team of University of Science and Technology of China, combined with the urban boundary data, the spatio-temporal distribution characteristics of ozone and its characteristic precursors (NO2 and HCHO), the seasonal variatiUsing the tropospheric monitoring instrument (TROPOMI) O3, NO2 and HCHO products developed by the team of University of Science and Technology of China, combined with the urban boundary data, the spatio-temporal distribution characteristics of ozone and its characteristic precursors (NO2 and HCHO), the seasonal variation and the differences between urban and rural areas of ozone generation control types in the Pearl River Delta region, China, from Sep. 2019 to Feb. 2020 were studied. Firstly, the results show that in terms of spatiotemporal distribution characteristics, the VCD (Vertical column density) of tropospheric NO2 in this area was significantly affected by the fluctuation of industrial sources during the observation period, while the variation of tropospheric HCHO VCD showed obvious seasonal differences. The VCD of tropospheric O3 were relatively high in Oct. 2019 and Feb. 2020, with 44.33 DU and 43.26 DU, respectively, and the ozone pollution in Foshan, Guangzhou and Dongguan was relatively serious. Then, in terms of seasonal variation of O3 generation control type, the ozone formation regime in the central area of the Pearl River Delta (PRD) region had obvious seasonal variation characteristics, it was mainly in the transition regime in autumn, and then turned into a VOCs-limited regime after entering the winter, while the peripheral area of PRD was mainly in the NOx-limited regime. Finally, in terms of urban-rural differences in O3 generating control types, the ozone formation regime in urban areas fluctuated significantly over time. In September 2019, 68.86% of the areas were NOx-limited areas, while in December, the proportion of VOCs-limited areas reached 77.80%. In comparison, the ozone formation regime in rural area was relatively stable, with the proportion of NOx-limited area ranging from 64.58% to 98.31% during the observation period..
Journal of Atmospheric and Environmental Optics
- Publication Date: Jan. 28, 2025
- Vol. 20, Issue 1, 47 (2025)

Research on retrieval method of atmospheric ozone column concentration from ultraviolet channel sunlight meter
QIAN Congcong, XUN Lina, LU Hui, LYU Dingyong... and LI Xin|Show fewer author(s)
On the basis of analyzing the ozone inversion bands of Dobson, Brewer and UV-PFR instruments, the data from the Pandora global atmospheric monitoring network in the same bands were used to invert the atmospheric ozone column density using the single-difference pair method and the double-difference pair method. In orderOn the basis of analyzing the ozone inversion bands of Dobson, Brewer and UV-PFR instruments, the data from the Pandora global atmospheric monitoring network in the same bands were used to invert the atmospheric ozone column density using the single-difference pair method and the double-difference pair method. In order to find the best band for ozone inversion, the inversion results of these two methods were compared with the atmospheric ozone column density retrieved from Pandora directly. The comparison results show that the inversion results using the single-difference wavelength pair (318 nm/332 nm) method and those using the double-difference wavelength pair (311 nm/332 nm, 318 nm/332 nm) method have a good consistency, while their relative mean difference and relative standard deviation with the direct inversion values from the Pandora global atmospheric monitoring network are both within 1%. The results of this study provide a basis for channel optimization of the ultraviolet channel solar photometer and high-precision ozone inversion..
Journal of Atmospheric and Environmental Optics
- Publication Date: Jan. 28, 2025
- Vol. 20, Issue 1, 60 (2025)

Monitoring and environmental impact analysis of volatile organic compounds in atmosphere of Guangde City
ZHU Sen, WANG Shuibing, QIN Zhiyong, and WEI Youwen
Multi-channel online GC-MS/FID was used to conduct short-term continuous monitoring of volatile organic compounds (VOCs) in the ambient air of industrial parks and urban living quarters in Guangde City, southeast of Anhui Province, China, from April to August 2021. And the concentration change, composition characteristMulti-channel online GC-MS/FID was used to conduct short-term continuous monitoring of volatile organic compounds (VOCs) in the ambient air of industrial parks and urban living quarters in Guangde City, southeast of Anhui Province, China, from April to August 2021. And the concentration change, composition characteristics, contribution to ozone generation potential and main sources of VOCs in the two typical monitoring sites were studied. The results showed that a total of 115 kinds of VOCs were detected in the two monitoring sites during the monitoring period, and the average volume fraction of total VOCs (TVOCs) was (115.13 ± 49.58) × 10-9 and (132.97 ± 26.66) × 10-9, respectively. Among the TVOCs detected, the top three species were aromatic hydrocarbons, alkanes and halogenated hydrocarbons. Further analysis of the positive matrix factorization (PMF) model showed that the main sources of VOCs at the two monitoring sites were slightly different. VOCs in the industrial park were mainly from solvent use, industrial emissions, plant emissions, vehicle exhaust, combustion sources, and liquefied petroleum gas (LPG) volatilization, while those in urban living areas mainly came from solvent use, industrial emissions, vehicle exhaust, LPG volatilization, and plant emissions. Specifically, among the VOCs emitted, aromatic hydrocarbons contributed the most to ozone generation potential in both monitoring sites..
Journal of Atmospheric and Environmental Optics
- Publication Date: Jan. 28, 2025
- Vol. 20, Issue 1, 69 (2025)
PM2.5 prediction in East China based on improved Seq2Seq model
CHEN Shanlong, LI Yi, NIU Dan, HU Yiwen, and ZANG Zengliang
PM2.5 data is a kind of time series data, which has strong time-series and non-linear characteristics. Traditional time series modeling algorithms include long short-term memory artificial neural network (LSTM), recurrent neural network (RNN), encoder-decoder neural network (Seq2Seq) and other methods. In this paper, wPM2.5 data is a kind of time series data, which has strong time-series and non-linear characteristics. Traditional time series modeling algorithms include long short-term memory artificial neural network (LSTM), recurrent neural network (RNN), encoder-decoder neural network (Seq2Seq) and other methods. In this paper, we propose a PM2.5 prediction algorithm based on Seq2Seq network fused with attention mechanism (Seq2Seq+Attention), where the cell unit of Seq2Seq is LSTM, which can fully extract the effective feature information of the input and enhance the learning ability and prediction effect of the network. Prediction tests were conducted using PM2.5 data from ten cities in East China from January 2019 to August 2021, and the tests compared the accuracy of PM2.5 numerical prediction of LSTM, Seq2Seq and Seq2Seq+Attention methods within 24 hours. The results show that the Seq2Seq+Attention method outperforms the other methods in terms of prediction effectiveness, and its 24-hour prediction score is also higher than the other methods..
Journal of Atmospheric and Environmental Optics
- Publication Date: Jan. 28, 2025
- Vol. 20, Issue 1, 82 (2025)
Development and preliminary application of portable hydrogen sulfide on-line detector
JIA Yanjie, LI Rongguang, SUN Ling, SUN Dongyuan... and QIU Xuanbing|Show fewer author(s)
Most of the natural gas mines in southwestern China are high-sulfur gas mines. Among high-sulfur gas, H2S presents a dual threat due to its high toxicity and propensity for corroding pipelines and instruments, which poses substantial safety hazards to gathering and transportation systems of natural gas. Therefore, rapiMost of the natural gas mines in southwestern China are high-sulfur gas mines. Among high-sulfur gas, H2S presents a dual threat due to its high toxicity and propensity for corroding pipelines and instruments, which poses substantial safety hazards to gathering and transportation systems of natural gas. Therefore, rapid and precise monitoring of H2S level in natural gas is of great significance for improving the safety and efficiency of sulfur-laden natural gas production. In response to this demand, a portable H2S online detector based on tunable diode laser absorption spectroscopy (TDLAS) technology was developed in this work. The main body of the detector was a high-temperature long-path absorption cell with a base length of 15 cm, and it adopted a seven-ring spot scheme with an effective optical path of 30 m. In combination with a pulse width modulation controller and mass flowmeter controllers, a digital proportional controller was used to achieve constant pressure and temperature in the absorption cell. A near-infrared laser with a central wavelength of 1578 nm was used as the laser source of the detector, and based on complex programmable logic device and analog phase-locking technology, the second harmonic (2f) modulation and demodulation of H2S spectral signal were achieved. Furthermore, the hardware system and software program for the control end of the portable detector were developed, which enables real-time display, storage, and transmission of H2S concentration. The detector was calibrated using H2S standard gases, and the results showed that the linear correlation coefficient (R2) between the detected 2f spectral signal of H2S and H2S concentration is high to 0.99786. Finally, a field test of the developed instrument was conducted at a natural gas pigging station in southwestern China, and the test results showed that the H2S concentration in the natural gas pipeline was high, with a peak value of 1.16 mg/m3, and the pipeline corrosion was severe on site, which preliminarily demonstrated the applicability of the developed portable H2S online detector..
Journal of Atmospheric and Environmental Optics
- Publication Date: Jan. 28, 2025
- Vol. 20, Issue 1, 95 (2025)
Spectral imaging system based on acousto-optic tunable filter
LIAO Jie, ZENG Yi, SONG Runze, ZHOU Haijin... and SI Fuqi|Show fewer author(s)
A spectral imaging system based on acousto-optic tunable filter (AOTF) was designed and built. The system consists of a front imaging lens, an AOTF, a relay objective, a CCD camera, an AOTF radio frequency driver, and a host computer. It can scan the wavelength of diffracted light from AOTF, and collects spectral imageA spectral imaging system based on acousto-optic tunable filter (AOTF) was designed and built. The system consists of a front imaging lens, an AOTF, a relay objective, a CCD camera, an AOTF radio frequency driver, and a host computer. It can scan the wavelength of diffracted light from AOTF, and collects spectral images using a CCD camera, ultimately generating a spectral image cube. The system can be applied in the range of 400–700 nm, with spectral resolution better than 1 nm, and it has no scanning mechanical structure and realizes the integration of image and spectrum. Field imaging experiments were carried out using this system, and the imaging result after being processed using the suppression method for 0-order light interference were clear and recognizable. Furthermore, the system was used to measure different NO2 sample gases with given concentrations from 3.62 × 10¹⁷–1.21 × 10¹⁹ molecule/cm2. The measured spectral data were retrieved by differential absorption spectrum algorithm to obtain the measured concentrations of NO2 sample gases. The error and correlation between the measured values and the given values were analyzed. It is shown that the errors are within 20% and the correlation coefficient of 0.99401, indicating a good correlation between the measured values and the given values, which verifies the feasibility of the system in pollution gas measurement..
Journal of Atmospheric and Environmental Optics
- Publication Date: Jan. 28, 2025
- Vol. 20, Issue 1, 104 (2025)
Design of CMOS low light level imaging electronics system based on FPGA
ZHANG Wei, and YU Lei
An imaging electronics system for a sunlight-induced chlorophyll fluorescence hyper-spectrometer has been designed to meet the detection requirements of high signal-to-noise ratio and high spectral resolution for weak fluorescence radiation. Based on the selection of complementary metal oxide semiconductor (CMOS), as wAn imaging electronics system for a sunlight-induced chlorophyll fluorescence hyper-spectrometer has been designed to meet the detection requirements of high signal-to-noise ratio and high spectral resolution for weak fluorescence radiation. Based on the selection of complementary metal oxide semiconductor (CMOS), as well as the requirements of detection, the control module and the decoding module of communication protocol are developed, and then the design of CMOS imaging system is completed. The control part selects field programmable gate array (FPGA) with strong parallel data processing ability, and the communication selects Camera-Link protocol with fast communication speed and specially built for camera. The expected signal-to-noise ratio of the designed system is about 31 dB. The design of the imaging system provides a good solution for fluorescence detection system which requires low noise and high imaging quality..
Journal of Atmospheric and Environmental Optics
- Publication Date: Jan. 28, 2025
- Vol. 20, Issue 1, 114 (2025)

