
Spin-momentum-mixing interactions with cavity-mediated supersolid in spinor condensates
Jingjun You, Su Yi, and Yuangang Deng
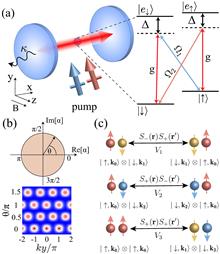
Ultracold atoms with cavity-mediated long-range interactions offer a promising platform for exploring emergent quantum phenomena. Building on recent experimental progress, we propose a novel scheme to create supersolid square and plane wave phases in spin-1/2 condensates. We demonstrate that the self-ordered supersolid phase supports an undamped gapless Goldstone mode across a broad parameter regime. This proposal is comprehensively described by the two-component Tavis–Cummings model with hosting a U(1) symmetry. By exploiting the superradiant photon-exchange process, our approach also constructs the cavity-mediated spin-momentum-mixing interactions between highly correlated spin and momentum modes, which may open avenues for exploring spin-momentum squeezing and spatially distributed multipartite entanglement.Ultracold atoms with cavity-mediated long-range interactions offer a promising platform for exploring emergent quantum phenomena. Building on recent experimental progress, we propose a novel scheme to create supersolid square and plane wave phases in spin-1/2 condensates. We demonstrate that the self-ordered supersolid phase supports an undamped gapless Goldstone mode across a broad parameter regime. This proposal is comprehensively described by the two-component Tavis–Cummings model with hosting a
- Mar. 28, 2025
- Photonics Research
- Vol. 13, Issue 4, 987 (2025)
- DOI:10.1364/PRJ.544164
High-efficiency multi-channel focusing and imaging enabled by polarization-frequency multiplexing non-interleaved metasurfaces
Xunjun He, Mingzhong Wu, Guangjun Lu, Ying Zhang, and Zhaoxin Geng
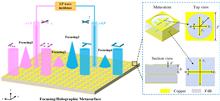
In microwave communication systems, focusing and imaging have attracted widespread attention due to their application prospects in the information processing and communication fields. Most existing multi-channel focusing and imaging are implemented by interleaved metasurfaces. However, the disadvantages of their large size and low efficiency limit their practical applications in large-capacity and low-loss integrated systems. To solve these issues, here, we propose a non-interleaved polarization-frequency multiplexing metasurface for high-efficiency multi-channel focusing and imaging. The meta-atoms of the non-interleaved metasurface are composed of a metallic ground plate, two dielectric layers, a larger cross-shaped metal structure, and a smaller cross-shaped metal structure embedded by a circular metal aperture. By altering the size of two cross-shaped structures, the designed meta-atom can obtain the independent complete 2π phase coverage with high reflection efficiency at two different frequency ranges for two orthogonal linear polarization (LP) incidences, realizing polarization multiplexing and frequency multiplexing. Moreover, two types of metasurfaces based on the above meta-atoms are designed to realize multi-channel focusing and imaging with high efficiency. As a proof, the focusing metasurface is fabricated and measured, and the measured results are well consistent with simulated results. Therefore, the proposed scheme has the advantages of high efficiency, multi-channel, and compact size, which possesses broad application prospects in low-loss and multi-channel communication integrated systems.In microwave communication systems, focusing and imaging have attracted widespread attention due to their application prospects in the information processing and communication fields. Most existing multi-channel focusing and imaging are implemented by interleaved metasurfaces. However, the disadvantages of their large size and low efficiency limit their practical applications in large-capacity and low-loss integrated systems. To solve these issues, here, we propose a non-interleaved polarization-frequency multiplexing metasurface for high-efficiency multi-channel focusing and imaging. The meta-atoms of the non-interleaved metasurface are composed of a metallic ground plate, two dielectric layers, a larger cross-shaped metal structure, and a smaller cross-shaped metal structure embedded by a circular metal aperture. By altering the size of two cross-shaped structures, the designed meta-atom can obtain the independent complete
- Mar. 28, 2025
- Photonics Research
- Vol. 13, Issue 4, 976 (2025)
- DOI:10.1364/PRJ.545173
Observation of multiple quasi-bound states in the continuum by symmetry breaking in a photonic crystal slab
Shuangli Li, Lujun Huang, Haozong Zhong, Minghao Ning... and Lin Li|Show fewer author(s)
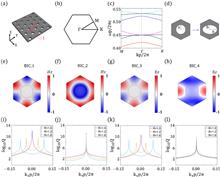
Bound states in the continuum (BICs) open up a unique avenue of enhancing light–matter interactions due to their extreme field confinement and infinite quality (Q) factors. Although tremendous progress has been made in the past 10 years, the majority of previous works focused on either a single BIC or dual BICs. In this work, we present both theoretical investigation and experimental demonstration on multiple BICs in a photonic crystal slab with a hexagonal lattice. All of these BICs at Γ-point can be categorized as symmetry-protected (SP) BICs. Furthermore, two BICs belong to merging BICs with topological charges q=-2. Breaking the structural symmetry will split these BICs with q=-2 into two accidental BICs with q=-1. While the other two are different from the former two, the Q-factors of both modes at the Γ-point retain a stably ultrahigh value (Q>108) when the circular hole is transformed into a rotated elliptical hole with different size ratios of semi-long and semi-short axes. In addition, the Q-factors of the latter two BICs decrease rapidly with kx, indicating that the quasi-BICs become accessible at an ultra-small incident angle. We also show that the Q-factors of the former two BICs exhibit different dependence on the asymmetry parameters, suggesting a viable way of realizing high-Q resonances at multi-wavelengths. Finally, we presented experimental demonstration of four high-Q quasi-BICs at four different wavelengths in the near infrared by fabricating a series of photonic crystal slabs made of rotated elliptical holes and characterizing their reflection spectra. We showed that most of the measured Q-factors are above 1000 for four quasi-BICs, and the highest one can reach 16,764. Our results may find promising applications in sum-frequency generation, four-wave mixing, multiband sensing, lasing, etc.Bound states in the continuum (BICs) open up a unique avenue of enhancing light–matter interactions due to their extreme field confinement and infinite quality (
- Mar. 28, 2025
- Photonics Research
- Vol. 13, Issue 4, 968 (2025)
- DOI:10.1364/PRJ.547681
All-fiber orbital-angular-momentum mode encoding system based on helical fiber gratings
Yu Chen, Ming Gao, Yutao Wang, Xinyue Huang... and Hongpu Li|Show fewer author(s)
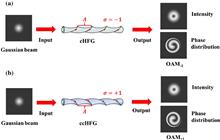
In this study, we propose and demonstrate an all-fiber orbital-angular-momentum (OAM) mode encoding system, where through helical fiber gratings (HFGs), binary symbols are encoded to or decoded from two OAM modes with topological charges (TCs) of -1 and +1, respectively. We experimentally validate that the OAM mode generated by a clockwise-helix HFG (cHFG) can be converted back into fundamental mode by using an HFG with a helix orientation opposite to that of the cHFG, i.e., ccHFG. Benefited from utilization of the HFGs, the proposed OAM mode encoding system has a low cost, low insertion loss, high mode conversion efficiency, and polarization independence. To the best of our knowledge, this is the first demonstration of the HFGs-based all-fiber OAM mode encoding/decoding scheme, which may find potential applications in optical communication and quantum communication as well.In this study, we propose and demonstrate an all-fiber orbital-angular-momentum (OAM) mode encoding system, where through helical fiber gratings (HFGs), binary symbols are encoded to or decoded from two OAM modes with topological charges (TCs) of
- Mar. 28, 2025
- Photonics Research
- Vol. 13, Issue 4, 960 (2025)
- DOI:10.1364/PRJ.544533
Fast parallel quantification for near-infrared genetically encoded reporters with self-calibrated photoacoustic screening
Xuanhao Wang, Yan Luo, Fudong Xue, Lijuan Ma... and Cheng Ma|Show fewer author(s)
The integration of near-infrared genetically encoded reporters (NIR-GERs) with photoacoustic (PA) imaging enables visualizing deep-seated functions of specific cell populations at high resolution, though the imaging depth is primarily constrained by reporters’ PA response intensity. Directed evolution can optimize NIR-GERs’ performance for PA imaging, yet precise quantifying of PA responses in mutant proteins expressed in E. coli colonies across iterative rounds poses challenges to the imaging speed and quantification capabilities of the screening platforms. Here, we present self-calibrated photoacoustic screening (SCAPAS), an imaging-based platform that can detect samples in parallel within 5 s (equivalent to 50 ms per colony), achieving a considerable quantification accuracy of approximately 2.8% and a quantification precision of about 6.47%. SCAPAS incorporates co-expressed reference proteins in sample preparation and employs a ring transducer array with switchable illumination for rapid, wide-field dual-wavelength PA imaging, enabling precisely calculating the PA response using the self-calibration method. Numerical simulations validated the image optimization strategy, quantification process, and noise robustness. Tests with co-expression samples confirmed SCAPAS’s superior screening speed and quantification capabilities. We believe that SCAPAS will facilitate the development of novel NIR-GERs suitable for PA imaging and has the potential to significantly impact the advancement of PA probes and molecular imaging.The integration of near-infrared genetically encoded reporters (NIR-GERs) with photoacoustic (PA) imaging enables visualizing deep-seated functions of specific cell populations at high resolution, though the imaging depth is primarily constrained by reporters’ PA response intensity. Directed evolution can optimize NIR-GERs’ performance for PA imaging, yet precise quantifying of PA responses in mutant proteins expressed in E. coli colonies across iterative rounds poses challenges to the imaging speed and quantification capabilities of the screening platforms. Here, we present self-calibrated photoacoustic screening (SCAPAS), an imaging-based platform that can detect samples in parallel within 5 s (equivalent to 50 ms per colony), achieving a considerable quantification accuracy of approximately 2.8% and a quantification precision of about 6.47%. SCAPAS incorporates co-expressed reference proteins in sample preparation and employs a ring transducer array with switchable illumination for rapid, wide-field dual-wavelength PA imaging, enabling precisely calculating the PA response using the self-calibration method. Numerical simulations validated the image optimization strategy, quantification process, and noise robustness. Tests with co-expression samples confirmed SCAPAS’s superior screening speed and quantification capabilities. We believe that SCAPAS will facilitate the development of novel NIR-GERs suitable for PA imaging and has the potential to significantly impact the advancement of PA probes and molecular imaging.
- Mar. 28, 2025
- Photonics Research
- Vol. 13, Issue 4, 941 (2025)
- DOI:10.1364/PRJ.546664

On-chip tunable single-mode high-power narrow-linewidth Fabry–Perot microcavity laser on Yb3+-doped thin-film lithium niobate
Qinfen Huang, Zhiwei Fang, Zhe Wang, Yiran Zhu... and Ya Cheng|Show fewer author(s)
Ytterbium ion (Yb3+)-doped lasers are widely used in precision machining and precision measurement fields because of their high efficiency and high power, which are primarily based on solid-state lasers and fiber lasers. Here, we demonstrate an on-chip Yb3+-doped thin-film lithium niobate (Yb:TFLN) Fabry–Perot microcavity laser. We achieve single-frequency laser operation at 1030 and 1060 nm with a side-mode suppression ratio above 30 dB, an emission linewidth below 40 pm, and an output power up to 1.5 mW at 1060 nm and 0.3 mW at 1030 nm. In addition, using the electro-optic effect of lithium niobate, we achieve a laser tuning efficiency of 4 pm/V. This work opens the path to on-chip high-power and mode-locked ultrafast laser output.Ytterbium ion (
- Mar. 28, 2025
- Photonics Research
- Vol. 13, Issue 4, 935 (2025)
- DOI:10.1364/PRJ.544945
Dilated space-and-wavelength selective crosspoint optical switch
Ziyao Zhang, Minjia Chen, Rui Ma, Bohao Sun... and Qixiang Cheng|Show fewer author(s)
Photonic integrated switches that are both space and wavelength selective are a highly promising technology for data-intensive applications as they benefit from multi-dimensional manipulation of optical signals. However, scaling these switches normally poses stringent challenges such as increased fabrication complexity and control difficulties, due to the growing number of switching elements. In this work, we propose a new type of dilated crosspoint topology, which efficiently handles both space and wavelength selective switching, while reducing the required switching element count by an order of magnitude compared to reported designs. To the best of our knowledge, our design requires the fewest switching elements for an equivalent routing paths number and it fully cancels the first-order in-band crosstalk. We demonstrate such an ultra-compact space-and-wavelength selective switch (SWSS) at a scale of 4×4×4λ on the silicon-on-insulator (SOI) platform. Experimental results reveal that the switch achieves an insertion loss ranging from 2.3 dB to 8.6 dB and crosstalk levels in between -35.3 dB and -59.7 dB. The add-drop microring-resonators (MRRs) are equipped with micro-heaters, exhibiting a rise and fall time of 46 μs and 0.33 μs, respectively. These performance characteristics highlight the switch’s ultra-low element count and crosstalk with low insertion loss, making it a promising candidate for advanced data center applications.Photonic integrated switches that are both space and wavelength selective are a highly promising technology for data-intensive applications as they benefit from multi-dimensional manipulation of optical signals. However, scaling these switches normally poses stringent challenges such as increased fabrication complexity and control difficulties, due to the growing number of switching elements. In this work, we propose a new type of dilated crosspoint topology, which efficiently handles both space and wavelength selective switching, while reducing the required switching element count by an order of magnitude compared to reported designs. To the best of our knowledge, our design requires the fewest switching elements for an equivalent routing paths number and it fully cancels the first-order in-band crosstalk. We demonstrate such an ultra-compact space-and-wavelength selective switch (SWSS) at a scale of
- Mar. 28, 2025
- Photonics Research
- Vol. 13, Issue 4, 924 (2025)
- DOI:10.1364/PRJ.543402
Brain-like training of a pre-sensor optical neural network with a backpropagation-free algorithm
Zheng Huang, Conghe Wang, Caihua Zhang, Wanxin Shi... and Hongwei Chen|Show fewer author(s)
Deep learning has rapidly advanced amidst the proliferation of large models, leading to challenges in computational resources and power consumption. Optical neural networks (ONNs) offer a solution by shifting computation to optics, thereby leveraging the benefits of low power consumption, low latency, and high parallelism. The current training paradigm for ONNs primarily relies on backpropagation (BP). However, the reliance is incompatible with potential unknown processes within the system, which necessitates detailed knowledge and precise mathematical modeling of the optical process. In this paper, we present a pre-sensor multilayer ONN with nonlinear activation, utilizing a forward-forward algorithm to directly train both optical and digital parameters, which replaces the traditional backward pass with an additional forward pass. Our proposed nonlinear optical system demonstrates significant improvements in image classification accuracy, achieving a maximum enhancement of 9.0%. It also validates the efficacy of training parameters in the presence of unknown nonlinear components in the optical system. The proposed training method addresses the limitations of BP, paving the way for applications with a broader range of physical transformations in ONNs.Deep learning has rapidly advanced amidst the proliferation of large models, leading to challenges in computational resources and power consumption. Optical neural networks (ONNs) offer a solution by shifting computation to optics, thereby leveraging the benefits of low power consumption, low latency, and high parallelism. The current training paradigm for ONNs primarily relies on backpropagation (BP). However, the reliance is incompatible with potential unknown processes within the system, which necessitates detailed knowledge and precise mathematical modeling of the optical process. In this paper, we present a pre-sensor multilayer ONN with nonlinear activation, utilizing a forward-forward algorithm to directly train both optical and digital parameters, which replaces the traditional backward pass with an additional forward pass. Our proposed nonlinear optical system demonstrates significant improvements in image classification accuracy, achieving a maximum enhancement of 9.0%. It also validates the efficacy of training parameters in the presence of unknown nonlinear components in the optical system. The proposed training method addresses the limitations of BP, paving the way for applications with a broader range of physical transformations in ONNs.
- Mar. 28, 2025
- Photonics Research
- Vol. 13, Issue 4, 915 (2025)
- DOI:10.1364/PRJ.539630
Floquet engineering with spatially nonuniform driving fields
Stella T. Schindler, and Hanan Herzig Sheinfux
In Floquet engineering, we apply a time-periodic modulation to change the effective behavior of a wave system. In this work, we generalize Floquet engineering to more fully exploit spatial degrees of freedom, expanding the scope of effective behaviors we can access. We develop a perturbative procedure to engineer space-time dependent driving forces that effectively transform broad classes of tight-binding systems into one another. We demonstrate several applications, including removing disorder, undoing Anderson localization, and enhancing localization to an extreme in spatially modulated waveguides. This procedure straightforwardly extends to other types of physical systems and different Floquet driving field implementations.In Floquet engineering, we apply a time-periodic modulation to change the effective behavior of a wave system. In this work, we generalize Floquet engineering to more fully exploit spatial degrees of freedom, expanding the scope of effective behaviors we can access. We develop a perturbative procedure to engineer space-time dependent driving forces that effectively transform broad classes of tight-binding systems into one another. We demonstrate several applications, including removing disorder, undoing Anderson localization, and enhancing localization to an extreme in spatially modulated waveguides. This procedure straightforwardly extends to other types of physical systems and different Floquet driving field implementations.
- Mar. 28, 2025
- Photonics Research
- Vol. 13, Issue 4, 905 (2025)
- DOI:10.1364/PRJ.545282
All-solid-state miniature laser gyroscope based on a single monolithic non-planar ring oscillator
Danqing Liu, Changlei Guo, Chunzhao Ma, Weitong Fan... and Hsien-Chi Yeh|Show fewer author(s)
He-Ne gaseous ring-laser gyroscopes (RLGs) have brought great breakthroughs in numbers of fields such as inertial navigation and attitude control in the past 50 years. However, their counterparts of all-solid-state, active RLGs have been far behind even though they have a few indispensable advantages. Here, we propose and demonstrate an all-solid-state, active RLG based on a millimeter-sized, single monolithic non-planar ring oscillator (NPRO) with a gain medium of Nd:YAG crystal or Nd-glass. The clockwise (CW) and counter-clockwise (CCW) laser modes in NPRO are simultaneously initiated under a regime of laser feedback interferometry, whose nonzero frequency difference intrinsically formats the single monolithic NPRO working as a Sagnac laser gyroscope without a noticeable lock-in effect. The higher wavefront distortion in NPRO samples is revealed to introduce less mode competition (higher beat frequency stability) between the two laser modes, which is a precondition to build the NPRO gyroscope. Under a free-running condition, the NPRO gyroscope typically has a bias instability of 31.3 deg/h and an angle random walk of 0.22 deg/h with a scale factor of 38.3 Hz/(deg s-1), and the instability is mainly caused by the magnetic noise at present. The NPRO gyroscope can be enclosed in a centimeter-sized package, with a power consumption below 0.7 W and a mass under 20 g. Moreover, the stability performance can be further improved by NPRO design and active noise suppression in the future. Such compact, low-power-consumed, and highly stable RLGs may find important applications in aerospace, defense, and industry.He-Ne gaseous ring-laser gyroscopes (RLGs) have brought great breakthroughs in numbers of fields such as inertial navigation and attitude control in the past 50 years. However, their counterparts of all-solid-state, active RLGs have been far behind even though they have a few indispensable advantages. Here, we propose and demonstrate an all-solid-state, active RLG based on a millimeter-sized, single monolithic non-planar ring oscillator (NPRO) with a gain medium of Nd:YAG crystal or Nd-glass. The clockwise (CW) and counter-clockwise (CCW) laser modes in NPRO are simultaneously initiated under a regime of laser feedback interferometry, whose nonzero frequency difference intrinsically formats the single monolithic NPRO working as a Sagnac laser gyroscope without a noticeable lock-in effect. The higher wavefront distortion in NPRO samples is revealed to introduce less mode competition (higher beat frequency stability) between the two laser modes, which is a precondition to build the NPRO gyroscope. Under a free-running condition, the NPRO gyroscope typically has a bias instability of
- Mar. 28, 2025
- Photonics Research
- Vol. 13, Issue 4, 897 (2025)
- DOI:10.1364/PRJ.543856
Journal
High photon-phonon pair generation rate in a two-dimensional optomechanical crystal
Mar. 22, 2025
Journal
Mar. 22, 2025
Structured light: fundamentals and applications (2025)
Call for Papers
Editor (s): Yuanjie Yang, Yangjian Cai, Qiwen Zhan
Innovative Optical Sensor Systems (2025)
Submission Open:15 January 2025; Submission Deadline: 30 April 2025
Editor (s): Nunzio Cennamo, Olivier Soppera, Giuseppe D’Aguanno, Yang Zhao
Emerging Coding Method for Computational Imaging (2025)
Submission Open:1 April 2025; Submission Deadline: 1 August 2025
Editor (s): Xin Yuan, David Brady, Enrique Tajahuerce, Jinli Suo... Liang Gao and Ni Chen|Show fewer author(s)
- <
- 1
- 2
- 3
- ...
- 100
- >

© Copyright 2018-2021 | Chinese Laser Press. All Rights Reserved 沪ICP备15018463号-20