- SJ_Zhang
- Apr. 6, 2025
Abstract
The operating lifetime under real-world climates is a critical metric to evaluate the commercial potential of any photovoltaic technology. Organic solar cells (OSCs) have experienced rapid breakthroughs in performance over the past decade owing to advances in device and materials engineering, including interfaces, electron acceptors, and donors. However, the intrinsic photodegradation of polymer donors remains poorly understood, and a path to stable OSCs is yet to be demonstrated under outdoor testing conditions. Herein we elucidate the side-chain-induced degradation mechanism in polymer donors and present an outdoor stability database covering 15 representative non-fullerene-based OSCs, supported by in-lab photostability and thermostability analysis. By understanding the performance losses induced by several photoactive layers and interfaces, we demonstrate that encapsulated non-fullerene-based OSCs can retain 91% of the initial efficiency after seven months of operation under hot and sunny Saudi Arabian climates. These findings reveal encouraging prospects of non-fullerene-based OSCs for outdoor applications.
Main
Organic solar cells (OSCs) offer advantages such as flexibility, semi-transparency, green-solvent processability and high power-to-weight ratios, enabling various applications for the Internet of Things, smart windows and net-zero greenhouses1,2. Driven by advancements in donor and acceptor materials, the power conversion efficiency (PCE) of OSCs has surpassed 20% (refs. 3,4). Alongside the rapid rise in performance, it is imperative to focus on device stability under real-world climates, to accelerate the market-readiness of OSC technologies5. Specifically, efficiency and stability have rapidly improved for narrow-band-gap small-molecule acceptors6,7,8,9,10,11,12. Another key driver in the progress of OSCs is the introduction of high-efficiency polymer donors13, of which degradation due to solar irradiation and thermal stress is critical to the OSCs during outdoor operation5,14,15,16. Yet, how the photo- and thermal-induced degradation of polymer donors shape the resulting outdoor stability of OSCs is still unclear, and a comprehensive operational outdoor study is not yet to be reported.
Polymer donors can undergo degradation via chemical reactions when exposed to oxygen and light17,18,19,20,21,22,23,24. Successful encapsulation largely prevents the ingress of oxygen or moisture into the devices25. Thus, understanding the light- and heat-induced degradation of polymer donors under sealed environments is instrumental for real-world applications26. The photodegradation of polymer donors slows down without oxygen, but chemical structure reorganization persists. Reactions such as hydrogen abstraction from alkyl side-chains, and homolytic scission between conjugated skeletons and pendant side-groups, yield photodegradation products and have been discovered as main degradation pathways21,26,27,28,29,30,31. Many of the high-efficiency polymer donors so far have been designed and synthesized to enhance the efficiency of OSCs, including PCE10, PM6 and D18 (Supplementary Figs. 1 and 2; refer to Supplementary Note 1 for the full names). It is therefore necessary to conduct a systematic investigation on the photostability of these state-of-the-art polymer donors.
Aside from photostability measurements conducted in a laboratory-controlled environment, it is essential to equitably evaluate the operating lifetime of OSCs under real-world conditions. Differences and similarities between in-lab and outdoor photostability can establish important criteria for understanding the structure–stability relationship. In recent years, most outdoor stability studies have focused on fullerene/polymer donor blends32. With the emergence of non-fullerene acceptors (NFA), outdoor stability of NFA-based OSCs lags behind their high-efficiency development, and limited comparison analysis on the outdoor stability of different polymer donors has been reported11,32,33,34,35. To elucidate the role of polymer donors in the outdoor stability of OSCs, it is imperative to collect extensive outdoor stability data for diverse donor and acceptor (D:A) combinations following the International Summit on Organic Photovoltaic Stability (ISOS) protocols32,36,37.
In this work we investigate how the selection of building blocks in polymer donors impacts the in-lab photostability of OSCs and demonstrate the device stability of NFA-based OSCs under outdoor conditions11,32. First, we elucidate the mechanisms of side-chain-induced photodegradation in polymer donors by tracking the photodegradation behaviours at both photochemical and morphological levels. Next, transitioning from the laboratory-controlled environment to outdoors, we investigate the outdoor stability of 15 different D:A-based devices to understand how the photostability of polymer donors affects the outdoor stability of the devices. Finally, we reveal that encapsulated NFA-based OSCs can retain 91% of the initial efficiency after seven months of operation in real-world climates, highlighting the potential of NFA-based OSCs for real-world applications.
Tracking OSC changes under illumination
As PM6 and D18 are two well-known high-efficiency polymers, and PCE10 is a classic low band-gap polymer donor for semitransparent OSCs1,38, we investigated their photostability in devices paired with the low band-gap acceptor Y6 (Fig. 1a)39. Figure 1b depicts the current density-voltage (J–V) curves of the devices, with champion PCEs of 14.7%, 15.3% and 8.9% for PM6-, D18- and PCE10-based devices, respectively (Supplementary Table 1). Photostability measurements were performed in accordance with the following protocol: devices were held at open-circuit conditions during 1 sun illumination (covering the UV–visible–NIR range; Supplementary Fig. 3), with a temperature of ~300 K under an N2 atmosphere36. After 2,000 h, the PCE10-based device kept 84% of its initial value, indicating a superior photostability over PM6 and D18 (Fig. 1c). The J–V curves of PM6-, D18- and PCE10-based devices under continuous illumination are presented in Fig. 1d–f. For all three systems, open-circuit voltage (VOC) and short-circuit current (JSC) slightly decrease (Supplementary Fig. 4), and the fill factor (FF) degradation is the main reason for the performance loss under illumination.
Fig. 1: Photodegradation and device mechanisms of OSCs.
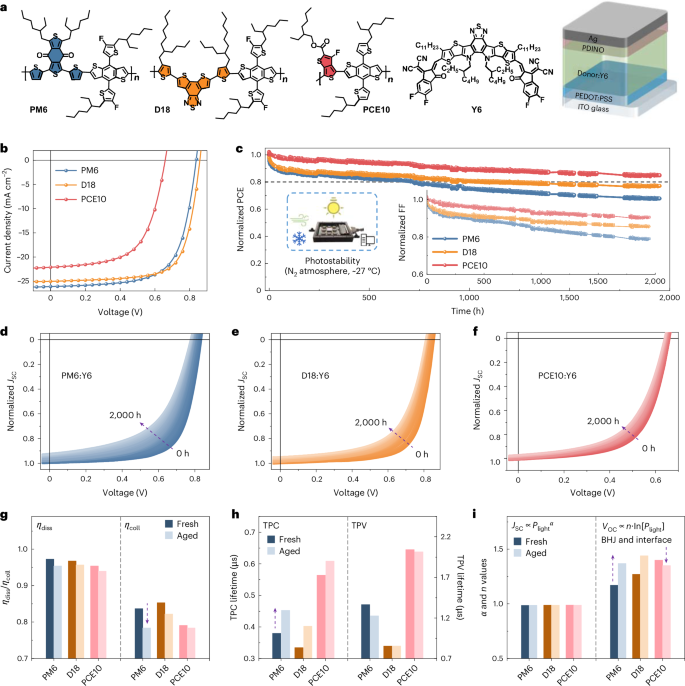
a, Chemical structures of PM6, D18, PCE10 and Y6, and the device structure for photostability measurements. b, J–V curves of the champion devices based on different polymer donors and Y6 (acceptor). c, Normalized performance loss (PCE and FF) during photostability tests. Initial PCEs for the devices: PM6:Y6 (14.7%); D18:Y6 (15.3%); PCE10:Y6 (8.9%). Initial FF for the devices: PM6:Y6 (67.3%); D18:Y6 (71.2%); PCE10:Y6 (60.7%). The photostability test was conducted under open-circuit conditions at 27 °C, using AM1.5 G 100 mW cm−2 illumination in an N2 atmosphere. d–f, J–V curves of PM6- (d), D18- (e) and PCE10-based (f) devices recorded under continuous illumination from 0 to 2,000 h, with arrows indicating the ageing trend. g, ηdiss and ηcoll values for the fresh and 200-h-aged devices. h, TPC and TPV lifetimes measured on the fresh and 200-h-aged devices (Supplementary Fig. 6 and Supplementary Table 2). i, α and n values for the fresh and 200-h-aged devices. The α values were obtained by fitting the JSC–Plight plots with the equation of JSC ∝ Plightα (Supplementary Fig. 7). Arrows in g–i indicate the device ageing behavior. For the n values, VOC versus Plight can be described byVOC ∝ n (kT/q) ln(Plight): where k, T and q are the Boltzmann constant, the temperature (in Kelvin) and the electron charge, respectively (Supplementary Fig. 8). The α and n values are summarized in Supplementary Fig. 9. The half-cell stability data for PM6:Y6- and PCE10:Y6-based devices are presented in Extended Data Fig. 1 to assess the contribution of BHJ layers and interfaces to device stability (Supplementary Fig. 10 and Supplementary Table 3). Device characterizations on the aged-PM6:fresh-Y6 and fresh-PM6:aged-Y6-based devices are summarized in Extended Data Fig. 2, including the ηdiss, ηcoll, TPC, TPV, α and n values (see Supplementary Table 3, and Supplementary Figs. 11 and 12, for details).
We tested the photocurrent density (Jph) versus effective voltage (Veff) for fresh and degraded devices to understand the photodegradation mechanism at the device level (Supplementary Fig. 5). The exciton dissociation efficiency (ηdiss) and charge collection efficiency (ηcoll) slightly decreased for all three systems after 200 h illumination (Fig. 1g). The PM6-based device exhibited a relatively rapid decline in ηcoll after illumination. Transient photocurrent (TPC) and transient photovoltage (TPV) measurements were performed on fresh and aged devices (Supplementary Fig. 6, Supplementary Table 2 and Supplementary Note 2). As shown in Fig. 1h, PM6- and D18-based devices exhibited longer TPC lifetimes than PCE10-based devices, indicating increased recombinations during illumination. By contrast, all three devices demonstrate relatively minor changes in TPV decays. The light intensity (Plight) dependence of JSC and VOC was studied. Figure 1i shows that the α values of all three systems are similar and close to one before and after photo-aging, indicating that bimolecular recombination is not the primary cause of the photodegradation. This finding aligns with TPV results and is supported by the time-delayed collection field characterizations11. The n values (fitted from VOC versus Plight) for the PM6- and D18-based devices increased from 1.17 to 1.37, and from 1.27 to 1.44, respectively, suggesting an increase in trap-assisted recombination after photo-aging.
To understand the influence of interfaces, acceptors and polymer donors on overall device stability, we subjected the devices to various aging conditions. Extended Data Fig. 1 shows that, under an inert atmosphere, the photodegradation of PM6:Y6-based devices occurs within the bulk heterojunction (BHJ) layer and at the interface. Notably, the decreased n values (Extended Data Fig. 1d) highlight the role of interface degradation40, as further evidenced by photo-aged PCE10:Y6-based devices (Fig. 1i). These findings suggest that, despite optimization efforts to reduce the photodegradation effect at interfaces (Supplementary Fig. 3b), PCE losses persist due to the photodegradation in both BHJ layers and interfaces. This observation aligns with reports indicating that interface degradation and increased surface recombination are common features in NFA-based devices5,40,41,42,43.
Despite the demonstrated interface stability, stability challenges persist within the BHJ layers5,7,27,30,41,42,43,44,45. Both PM6 and Y6 have been reported to be susceptible to photodegradation in the absence of environmental species (such as H2O/O2)8,11,22,46,47. To investigate their contribution, we subjected the PM6- and Y6-based thin films to a separate photo-aging process and subsequently combined them with fresh-Y6 and PM6 to fabricate the devices. Extended Data Fig. 2 shows the photodegradation of PM6 is relatively more pronounced than that of Y6, consistent with refs. 46,47. Recent findings also indicate that PM6 is the weak link in the photostability of PM6:Y6 blends when exposed to ambient air22. It therefore becomes clear that the presence of photodegradation in polymer donors contributes to the PCE losses in devices22,26,46,47. Transitioning from polymer donors PM6, D18 to PCE10 effectively improves device photostability (Fig. 1).
Understanding the photodegradation of polymer donors
For polymer donors, hydrogen abstraction from alkyl side-chains, and homolytic scission between conjugated skeletons and pendant side-groups, prove to be the degradation pathways under illumination21,26,27,28,29,31. As shown in Fig. 2a, hydrogen abstractions from alkyl side-chains produce two different radicals (Macro-R˙ and H˙), mainly originating from Cα–H bonds and Cβ–H bonds26,27,28. Meanwhile, homolytic scissions generate two other types of radicals (Marco˙ and R˙). These radicals can recombine with each other to form by-products such as cleaved side-chains, radicals, twisted backbones22,26 and cross-linked polymers. The bond-dissociation energy quantifies the activation energy involved in radical reactions and reflects the chemical stability of molecules42,48. Generally, the analysis of polymer systems with extensive electronic attributes—including bond strength and bond-dissociation energy—can be accomplished through bond order analysis, which involves quantifying the integrated negative Laplacian electron density, known as Laplacian bond order (LBO) (Supplementary Note 3)48.
Fig. 2: Photochemical degradation of polymer donors.
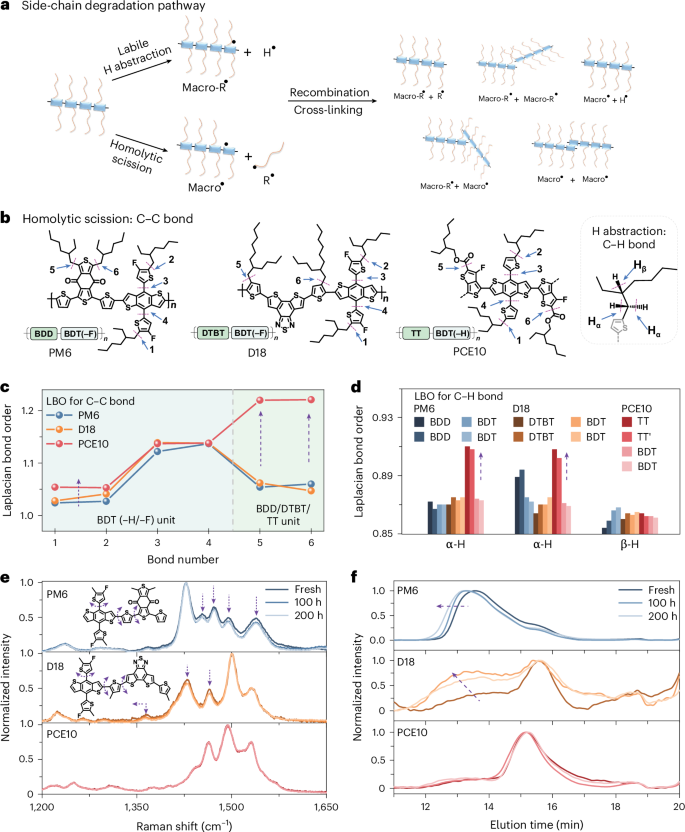
a, Schematic representation of the photodegradation pathways for polymer donors. b, Schematic diagram of the C–C/C–H bonds in the polymer donors for calculating LBO values. The sequence for labelling chemical bonds is based on the chemical structures of the building units: bonds 1 and 2 correspond to the C–C bond linking the outer alkyl chain to donor units (BDT–H/–F); bonds 3 and 4 correspond to the C–C bond linking the thiophene side-chain to donor units (BDT–H/–F); and bonds 5 and 6 correspond to the C–C bond linking the alkyl chains to acceptor units, including benzo[1,2-c:4,5-c']dithiophene-4,8-dione (BDD), dithienobenzothiadiazole (DTBT), and thieno[3,2-b]thiophene (TT). For PCE10, two isomeric structures were calculated because of the asymmetry feature within TT units. To ensure the accuracy of the LBO methods, we validated the LBO values by: (1) employing different theoretical methods and basis sets; (2) using different repeat units; and (3) considering both aromatic and quinoid structures for polymer donors (Supplementary Figs. 13–16). c, Laplacian bond order values for the homolytic scission. d, Laplacian bond order values for the hydrogen abstraction of alkyl side-chains. e, Experimental Raman spectra for the fresh and aged polymer donors. The simulated degradation modes for PM6 and D18 are summarized in Supplementary Figs. 17–29 and Supplementay Note 4. Notably, we observed a different degradation mode for PM6 in Raman spectra (in the absence of O2) with the one in the presence of O2 (ref. 22). We further conducted Raman measurements on these polymer donors after photo-aging in the presence of O2, observing a degradation mode in PM6 consistent with both reports (Supplementary Fig. 35). This confirms that the photodegradation characteristics of polymer donors differ when exposed to white LEDs, in the presence and absence of oxygen and moisture16,20,51. f, Gel permeation chromatography curves for the polymer donors before and after photo-aging.
Laplacian bond order analysis was performed using DFT calculations to understand the photodegradation behaviours in polymer donors48—a higher LBO value indicates a more resilient molecule towards unstable radical formation and subsequent photodegradation. Figure 2b,c shows that the C–C bonds in PCE10 exhibit higher LBO values than those in D18 and PM6, indicating suppressed homolytic scission in PCE10. The enhanced bond strength in PCE10 is mainly attributed to the C–C bonds linking the outer alkyl chains with acceptor moieties (bonds 5 and 6). Figure 2d reveals that the thieno[3,4-b]thiophene (TT) unit in PCE10 also exhibits higher LBO values for labile hydrogen abstraction than those in D18 and PM6 (Cα–H bonds). These results indicate that both homolytic scission and H abstraction are suppressed in PCE10 (Supplementary Figs. 13–16).
We conducted 1H-NMR measurements on polymer thin films before and after photo-aging to confirm the side-chain-induced photodegradation of polymer donors. Extended Data Fig. 3 shows new peaks emerged in the 1–1.2 ppm range for the aged-PM6 samples, corresponding to the alkyl chain region. This observation aligns with the degradation pathway involving the alkyl side-chains and the recent findings on side-chain-induced photodegradation in dioxythiophene-based polymers26. Raman spectra (Fig. 2e) reveal illumination-induced changes in D18 and PM6 that are attributed to side-chain and backbone twisting, as supported by DFT simulations (Supplementary Figs. 17–29 and Supplementary Note 4)22,26. Fourier-transform infrared spectroscopy (Supplementary Fig. 30) shows no considerable difference between the fresh and aged films, indicating that polymer backbones are relatively photostable (Supplementary Fig. 31). Gel permeation chromatography (GPC) results (Fig. 2f) demonstrate that D18 and PM6 suffered from the formation of cleaved and cross-linked by-products after illumination.
Photochemical stability of organic materials at the molecular level belongs to subnanometre changes during photodegradation. We conducted thermostability measurements at temperatures close to those used in photostability tests to further understand the thermal and light-driven morphological changes. Supplementary Fig. 32 indicates that devices based on PM6, D18 and PCE10 are thermally morphological stable44,49. Atomic force microscopy (AFM) and grazing-incidence wide-angle X-ray scattering (GIWAXS) measurements show no clear morphological changes in these samples under dark storage conditions or continuous illumination (500 h), consistent with the recent findings8,22,47,50,51,52.
Grazing-incidence small angle X-ray scattering (GISAXS) and high-resolution transmission electron microscope (HR-TEM) measurements were employed to track further light-driven morphological changes at nanometre scale. Figure 3a–g shows the decreased radius of gyration (Rg) in aged D18- and PCE10-based blends, suggesting domain shrinkage after photo-aging. Moreover, decreased scattering intensity in the low q-region for PM6- and PCE10-based blends indicates the disappearance of large structures/domains, consistent with findings from operando GISAXS measurements52. The HR-TEM images (Fig. 3h,i) demonstrate well-mixed D–A phases in all three blends before and after photo-aging (Supplementary Fig. 34)3,53,54. These results indicate that light-driven morphological changes in these photodegraded blends (up to 200 h photo-aging) are confined to tens of nanometres, with no substantial aggregates observed in the HR-TEM images52,53,54.
Fig. 3: Tracking morphological changes of donor:Y6-based blends at nanometre scale.
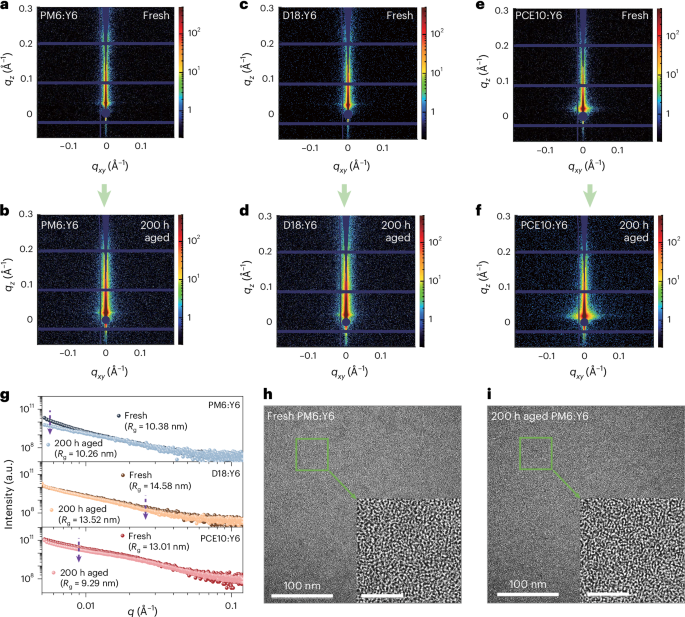
a–f, Two-dimensional GISAXS patterns for PM6:Y6-, D18:Y6- and PCE10:Y6-based blends before (a,c,e) and after (b,d,f) 200 h photo-aging. g, One-dimensional GISAXS line-cuts for PM6:Y6-, D18:Y6- and PCE10:Y6-based blends before and after 200 h photo-aging. The GISAXS fitting was analysed using the unified model according to Beaucage’s method (see Supplementary Fig. 33 for details on fitting), which takes into account several Guinier and Porod regimes. Scattering domains of the different samples are approximated to spheres to give an estimation of the fractal dimension (P) and the radius of gyration (Rg). h,i, HR-TEM images for the PM6:Y6-based blends before (h) and after (i) 200 h photo-aging. The inset scale bars are 20 nm. Refer to Supplementary Fig. 34 for further details on the HR-TEM images for D18:Y6- and PCE10:Y6-based blends.
Tracking changes at subnanometre scales—as demonstrated by Raman spectroscopy, GPC, 1H-NMR, material-stability results (Extended Data Figs. 1–3 and Supplementary Fig. 35) and mass spectrometry analysis (Supplementary Fig. 36)—reveals that light triggers molecular chemical structure changes in polymer donors, including side-chain-induced cross-linking and backbone twisting at subnanometre scale (Supplementary Note 6)26,29. Transitioning from the subnanometre to nanometre scales, domain shrinkage is observed in photo-aged blends5,52. Therefore, in the future, intrinsic photochemical and morphological stability should be considered to unlock the full potential of OSCs for outdoor applications. Overall, these results confirm that, in addition to light-induced morphological changes at nanometre scale, suppressing side-chain-induced photochemical degradation pathways and minimizing backbone twisting at subnanometre scales can effectively improve the photostability of the devices.
Side-chain-induced photodegradation in polymer donors
To further demonstrate the generality of the side-chain-induced photodegradation mechanism, we examined five additional polymers: PBDTTT-E-T, PBQx-TF, PBDB-T (ref. 13), PTZ1 and PBDTT-DPP (Fig. 4a; refer to Supplementary Note 1 for the full names). To minimize the other factors and investigate the role of polymer donors, we evaluated the device stability following the same procedure used in Fig. 1c. The photovoltaic performance is listed in Supplementary Table 4 (Supplementary Fig. 37; see Supplementary Fig. 38 for the LBO values), whereas the photostability results are presented in Fig. 4b. Devices fabricated by PBDTTT-E-T (similar to PCE10) and PBQx-TF (similar to D18) retained 88–90% of the initial PCEs after 500 h illumination, and the PBDTT-DPP-based device suffered the most serious degradation (71% PCE retention). PCE10 demonstrated the highest device photostability of the polymers studied (Figs. 1 and 4; refer to Supplementary Fig. 39 for the photostability of PTQ10). Figure 4c shows that PCE10 exhibits the highest LBO values and is the most photostable donor of the polymer materials studied (refer to the Raman and GPC results in Extended Data Fig. 4).
Fig. 4: Generality of side-chain-induced photodegradation in the studied polymer donors.
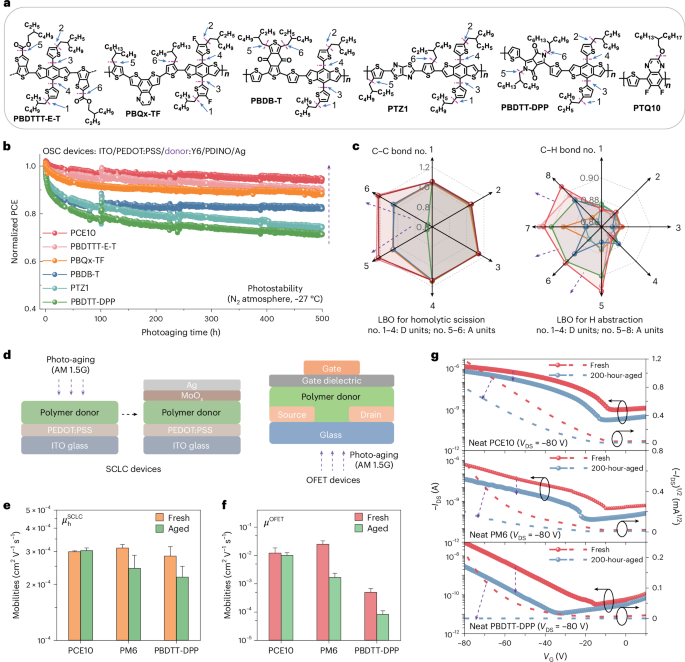
a, Chemical structures of the polymer donors. b, Photostability of the donor:Y6-based devices (ITO/PEDOT:PSS/donor:Y6/PDINO/Ag, with the full names of ITO, PEDOT:PSS and PDINO provided in Supplementary Note 1) under open-circuit conditions at 27 °C, using AM1.5 G 100 mW cm−2 illumination under N2 atmosphere: PCE10 > PBDTTT-E-T > PBQx-TF > PBDB-T > PTZ1 > PBDTT-DPP (refer to Supplementary Note 1 for the full names). Initial PCEs for the devices: PCE10:Y6 (8.9%); PBDTTT-E-T:Y6 (6.5%); PBQx-TF:Y6 (13.9%); PBDB-T:Y6 (3.7%); PTZ1:Y6 (10.7%); PBDTT-DPP:Y6 (2.1%). c, Laplacian bond order values for the homolytic scission and hydrogen abstraction (Cα–H) in polymer donors. Raman spectra and GPC curves of the studied polymer donors, before and after photo-aging, are provided in Extended Data Fig. 4. d, Schematic of the hole-only devices and OFETs before and after 200 h of photo-aging. e,f, Space-charge limited current (SCLC) (e) and OFET (f) mobililies for the polymer donors before and after aging. The error bars represent the s.d. of the mean from independent measurements, with the centre for the error bars indicating the mean value. For SCLC devices: fresh PCE10 (n = 9); fresh-PM6 (n = 12); fresh PBDTT-DPP (n = 11); aged PCE10 (n = 12); aged-PM6 (n = 12); aged PBDTT-DPP (n = 12); for OFET devices (n = 18). g, Transfer curves of the representative PCE10-, PM6- and PBDTT-DPP-based devices: gate-to-source voltage (VGS), drain-to-source current (IDS), gate-to-source voltage (VGS) and drain-to-source voltage (VDS) = −80 V.
To investigate whether the photodegradation of polymer donors affects stability in other organic electronic devices, we examined the photodegradation behaviour of polymer donors using hole-only devices and organic field-effect transistors (OFETs). The mobility values, μhSCLC (from hole-only devices; see Supplementary Figs. 40 and 41) and μOFET (from OFETs), before photo-aging are consistent with refs. 55,56. Figure 4d–g shows that PCE10-based devices demonstrate relatively stable mobilities after photo-aging, whereas PM6 and PBDTT-DPP showed obvious decreased mobilities in the hole-only devices and OFETs.
To recap: when combining the above photostability results with the photodegradation mechanism analysis, it is evident that—in addition to the light-induced morphological changes at nanometre scale52—enhancing the photochemical stability of polymer donors can effectively improve the photostability of devices5,22,26. We further gathered photostability data of 22 different polymer donors from the references (refer to Supplementary Figs. 42–45 and Supplementary Tables 5–7). The observed photostability trends among these polymer donors align with the trends in LBO values, indicating the importance of using intrinsically photochemical stable polymer donors in OSCs (Supplementary Note 7)42. We found that the most stable NFA-based OSCs reported so far were fabricated using PCE10 as the donor (where the photo-aging condition was close to the AM1.5 G spectrum)41,57, consistent with our results. It is worth noting that the photostability of OSCs is influenced by a comprehensive degradation mechanism, as illustrated by the LBO values in Supplementary Fig. 44 and a discussion of their limitations in Supplementary Note 8. Although understanding the correlation of all the factors and device stability requires considerable effort and is beyond the scope of this work, it is clear that ensuring intrinsic photochemical stability of polymer donors is an efficient strategy for stable OSCs.
Device stability under outdoor field conditions (ISOS-O-2)
Having elucidated intrinsic photodegradation of polymers, we set out to understand the outdoor stability of OSCs and the role of polymer donors. First, the interfaces must withstand both solar irradiation and heat stress under sunny and hot Saudi Arabian climates. Although PDINO exhibits relatively higher photostability compared with the other interfaces (Supplementary Fig. 3b), it becomes unstable above 65 °C. To mitigate interface degradation under outdoor conditions, we optimized the interfaces using PNDIT-F3N to withstand the heat stress prevalent in hot Saudi Arabian climates (Extended Data Fig. 5)58. Second, the devices were encapsulated to prevent O2/H2O from degrading the devices25. In this way, outdoor stability relies on solar irradiance and heat stress.
We first investigated the outdoor performance of the devices based on the model polymer donors in Fig. 1. Figure 5a shows that PCE10-based devices remain more outdoor-stable than PM6- and D18-based devices, whereas the PM6:Y6 cell is the most unstable one. Notably, the stable PCE10-based devices—both in this study and in the literature38,41,57—were evaluated under either an inert atmosphere or with robust encapsulation technologies. The Raman spectra (Supplementary Fig. 35, conducted without N2 protection) reveal that PCE10 is highly unstable in the presence of O2/H2O under illumination. This observation aligns with recent findings indicating that O2/H2O can accelerate the photodegradation of polymer donors22, highlighting the importance of developing stable polymer donors, particularly for large-area production lines and photovoltaic modules exposed to ambient air. These results also demonstrated that the robust encapsulation can effectively prevent O2/H2O from degrading the devices, contributing to the overall outdoor stability of PCE10:Y6-based devices25.
Fig. 5: Outdoor stability of the OSC devices.
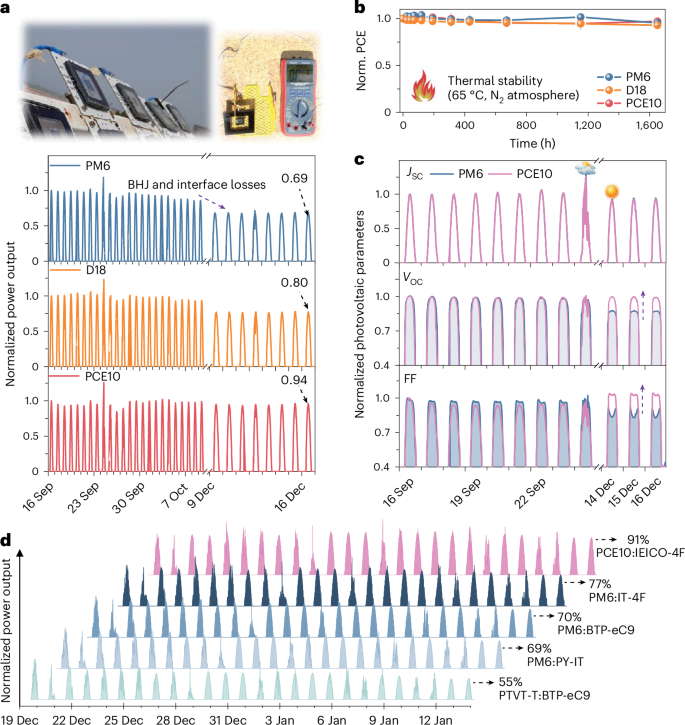
a, Outdoor stability (ISOS-O-2) of the encapsulated OSC devices from September 2022 to December 2022. The photo shows devices mounted on the solar tracking platform and the measurement of cell temperature through a thermometer (testing field on the KAUST campus, Thuwal, Saudi Arabia). Initial PCEs for the encapsulated devices (Supplementary Fig. 49): PM6:Y6 (13.6%); D18:Y6 (13.8%); PCE10:Y6 (9.1%). The PCE loss comes from both BHJ and interface degradation (see Extended Data Figs. 1, 2 and 5). b, Thermal stability of the devices (65 °C, H2O < 0.1 ppm and O2 < 10 ppm). The error bars represent the standard deviation (s.d.) of independent measurements (n = 6, 6, and 5 for PM6:Y6, D18:Y6, and PCE10:Y6, respectively), and the centres represent the average values. c, Normalized photovoltaic parameters of the PM6- and PCE10-based devices under outdoor testing. Initial parameters for the encapsulated devices: PM6:Y6 (VOC = 0.82 V; JSC = 24.6 mA cm–2; FF = 67.3%); PCE10:Y6 (VOC = 0.67 V; JSC = 22.4 mA cm–2; FF = 59.9%). d, outdoor stability of the PTVT-T:BTP-eC9 (low-cost donor polymer), PM6:PY-IT (all-polymer solar cell), PM6:BTP-eC9, PM6:IT-4F and PCE10:IEICO-4F (famous D:A for semitransparent OSCs) devices from December 2021 to January 2022. Initial PCEs for the encapsulated devices: PTVT-T:BTP-eC9 (8.7%), PM6:PY-IT (14.7%), PM6:BTP-eC9 (14.0%), PM6:IT-4F (13.1%), and PCE10:IEICO-4F (9.6%). Detailed outdoor stability data with molecular structures of the donors and acceptors are present in Supplementary Fig. 47, and both photo- and thermal stability measurements (Supplementary Fig. 48) were conducted to understand outdoor stability of the devices in Fig. 5d.
Throughout the calendar year, the operational temperature of solar cells in the King Abdullah University of Science and Technology (KAUST) area, located on the Saudi Arabian coast by the Red Sea59,60, can reach 60–70 °C under outdoor conditions. We therefore performed thermostability measurements (65 °C) for these cells to isolate the effect of heat stress on outdoor stability (thermal-induced morphological degradation). Figure 5b shows that PM6, D18 and PCE10-based devices retained 95%, 93% and 97% of the initial PCEs after 1,650 h long-term thermal-aging, respectively, indicating that these conventional devices are thermally stable. Thus, the outdoor stability of these polymer donors is mainly governed by their photostability. Although thermally induced morphological degradation alone is not the main cause of the performance loss in devices under outdoor conditions, heat stress may have a thermal activation effect on the photo-induced chemical degradation of polymer donors23.
Figure 5c shows that the PM6:Y6 cells suffered from the VOC and FF losses, attributed to the degradation of both BHJ layer and interface (Extended Data Figs. 1, 2 and 5). By contrast, the PCE10:Y6 cells exhibited stable VOC and FF after three months. The increased FF of the PCE10:Y6 cell from September to December is owing to the relatively low solar irradiance in December. We also observe a slightly increased VOC for the PCE10:Y6 cells from September to December, which is mainly caused by the decreased temperature in December (see Extended Data Fig. 6 and Supplementary Fig. 46).
We further assessed the outdoor stability of devices on the basis of a further five representative D:A combinations: PCE10:IEICO-4F, PM6:IT-4F, PM6:BTP-eC9, PM6:PY-IT and PTVT-T:BTP-eC9. Molecular structures of the materials with outdoor stability data are given in Supplementary Figs. 47 and 48. Figure 5d highlights that the PCE10:IEICO-4F-based cell remains the most outdoor stable device. This outdoor stability feature is attributed to the photostable polymer donor PCE10 and relatively photostable IEICO-4F among other NFAs, as proven in the literature9.
We fabricated the ternary solar cells with PCE13 (possessing unstable sulfur-containing side-chains compared to PM6) in PM6:PY-IT blends to further understand the photodegradation of polymer donors under outdoor conditions. As shown in Extended Data Fig. 7 (see also the PCE and LBO values in Supplementary Table 9 and Supplementary Fig. 50), PCE13-based devices demonstrate rapid performance degradation under both in-lab illumination and outdoor conditions. Thus, avoiding weak chemical bonds in the side-chains of polymer donors is an effective strategy to improve the photostability of binary OSCs, as demonstrated by the photostable PCE10, PBDTT-E-T and PTVT-T (Supplementary Fig. 48). Furthermore, incorporating a photostable guest polymer donor, such as 50% amount of guest PBQx-TF in host PM6:PY-IT blends, offers an effective strategy for improving photostability of OSCs (Supplementary Fig. 51)61.
Overall, as delineated in the outdoor database encompassing 15 different D:A-based OSCs (Extended Data Fig. 8), the most stable NFA-based OSCs were fabricated using PCE10:Y6 and PCE10:IEICO-4F, agreeing with the predicted T80 (that is, the time taken for the PCE to decrease to 80% of its initial value) of the devices over 20 and 30 years41,57. Herein the relatively stable outdoor performance of PCE10:Y6 and PCE10:IEICO-4F-based devices is attributed to several factors, including the relatively photostable nature of PCE10, the robust (against heat stress) interlayer PNDIT-F3N58, reliable encapsulation25, and the comparatively high photostability of Y6 and IEICO-4F among NFAs9. Although we have optimized interfaces that are relatively stable for outdoor stability measurements, it is noteworthy that existing surface recombination during photo- and outdoor aging will become a dominant factor in the relatively stable BHJ blends (Extended Data Figs. 1, 2 and 5), such as PCE10:Y6 (Fig. 1i). However, it is difficult to extract T80 lifetime from outdoor databases with over 90% fitting confidence bounds42,57, which is due to: (1) nonlinear effects between Plight and PCEs under solar irradiation37; (2) temperature fluctuations affecting PCEs (Extended Data Fig. 6); and (3) daily performance under real-world climates being influenced by factors such as the local solar spectrum and dust59,60.
To understand the real lifetime of PCE10:Y6 devices, we performed outdoor stability measurements over seven months. Figure 6 shows that the D18:Y6 and PM6:Y6 cells retained 78.8% and 67.1% of the initial PCEs after seven-month outdoor working. In contrast, the PCE10:Y6 device retained 91.5% of the initial PCE, showing robust outdoor performance. It should be noted that the outdoor stability of OSCs is governed by a more complex degradation mechanism than in-lab photostability as discussed above, including: (1) environmental stresses such as solar irradiation, heat and environmental species (O2/H2O); and (2) the stability of electrodes, interlayers and photoactive layers, along with the interactions between these components5,45,62. We believe that future research, combining these insights with the outlined importance of employing intrinsically photochemically stable OSC materials, would unleashing the full potential of NFA-based OSCs in real-world applications.
Fig. 6: Seven-month outdoor stability of the cells from September 2022 to April 2023.
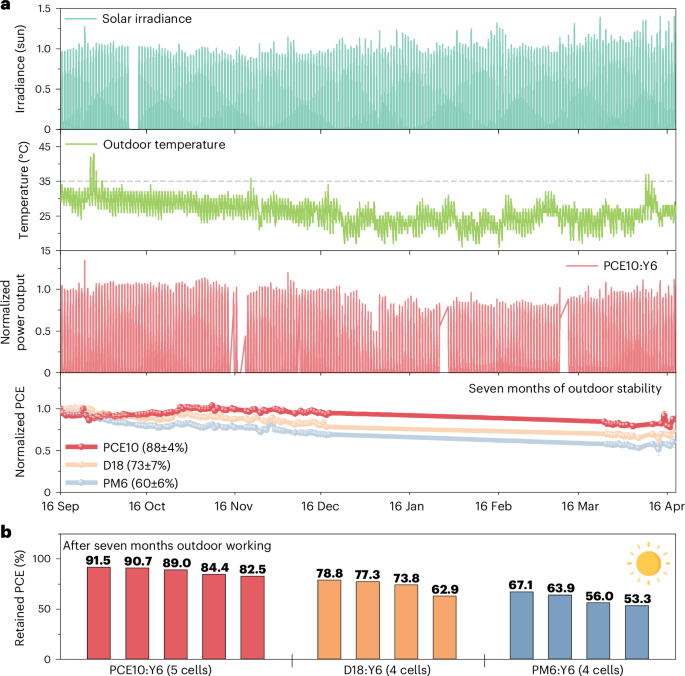
a, Solar irradiance, normalized power output (the most stable cell), and PCEs of the PCE10:Y6, D18:Y6 and PM6:Y6 cells. PCEs were calculated based on the power output and solar irradiance around 12:00 PM each day. The error bars represent the s.d. of independent measurements (n = 4, 4 and 5 for PM6:Y6, D18:Y6 and PCE10:Y6, respectively), and the centres represent the average values. Initial PCEs for the encapsulated devices (Supplementary Fig. 49 and Supplementary Table 8): PM6:Y6 (13.5 ± 0.1%); D18:Y6 (13.9 ± 0.2%); PCE10:Y6 (9.0 ± 0.1%). b, Retained PCEs of the devices after seven-month outdoor working. The cells were facing south with an angle of 25° and located in the KAUST campus, Saudi Arabia. The angle for the south-facing encapsulated cells (PM6:Y6 and PCE10:Y6) was slightly changed during 20 December 2022 to 24 March 2023. All of the cells were working, but we found there is a mismatch between the solar irradiance and power output during this period. It is also challenging to calculate PCEs during low irradiance and cloudy days. As a result, PCE data from 20 December 2022 to 24 March 2023 and the cloudy days were excluded from the analysis. The environmental data (outdoor temperature) were obtained from the KAUST weather station, and the temperature effect is presented in Extended Data Fig. 6. All the outdoor stability database is available in the Supplementary information and Source Data.
Conclusion
In summary we unravelled the generality of side-chain-induced photodegradation mechanisms in polymer donor materials. Aside from ensuring the stability of acceptors and interfaces, the use of polymer donors that are intrinsically photochemically stable benefits the photostability of devices under AM1.5 G illumination in an inert atmosphere and during outdoor solar irradiation in Saudi Arabian climates. Furthermore, we provided the outdoor stability database covering 15 representative D:A-based blends, instructively supported by the in-lab photostability and thermostability analysis for each blend. We demonstrated that through the optimization of photoactive layer and interface stability, the encapsulated PCE10:Y6-based devices retained ~91% of the initial PCEs after seven months of outdoor operation under the hot and sunny Saudi Arabian climate. In the future, we anticipate that NFA-based OSCs hold promising prospects for real-world applications.
Methods
Materials
PM6, PBDTTT-E-T, PTZ1, PTVT-T, PBQx-TF, PY-IT, BTP-eC9, IT-4F, PDINO, PNDIT-F3N, PNDIT-F3N-Br and PFN-Br were purchased from Solarmer Materials Inc. PCE10, PBDB-T, PTQ10, PCE13 and IEICO-4F were purchased from 1-Material Inc. D18 and Y6 were purchased from Nano Cleantech Inc. The monomers (five buliding block units) in PM6, D18 and PCE10 (used in Supplementary Fig. 29) were purchased from Solarmer Materials Inc. PBDTT-DPP was purchased from Luminescence Technology Corporation PEDOT:PSS (Clevios PVP Al4083) was purchased from Heraeus. Chloroform, methanol and acetic acid were purchased from Sigma Aldrich Inc. Pre-patterned 10 Ω sq–1 ITO-coated glass substrates were purchased from Xinyan Technology.
Solar cell fabrication and characterizations
ITO substrates were cleaned in a series of 10 min ultrasonic baths using detergent water, deionized water, acetone and isopropyl alcohol. After drying with nitrogen flow, ITO substrates were treated with ozone plasma for 10 min. PEDOT:PSS was spin-coated on top of ITO at 6,000 r.p.m. for 60 s and then annealed at 160 °C for 10 min. To prepare the solution of photoactive layers, the donor and acceptor were dissolved in chloroform with a D/A ratio of 1:1.2 and stirred at 45 °C for 2 h. To prepare blends of PM6:Y6, PCE10:Y6, PBDTTT-E-T:Y6, PBQx-TF:Y6, PTZ1:Y6, PBDB-T:Y6 and PTQ10:Y6, the solutions with a total concentration of 15.4 mg ml–1 were spin-coated at 3,000 r.p.m. For the D18:Y6 solution, the total concentration was 11 mg ml–1 and the spin-speed was 2,000 r.p.m. For the PBDTT-DPP:Y6 solution, the total concentration was 8.8 mg ml–1 and the spin-speed was 3,000 r.p.m. The photoactive layers were further annealed at 100 °C for 10 min. To compare the intrinsic photostability of these polymer donors, no additive or other post-treatment process was involved. Another five representative blends were chosen to conducted the outdoor stability measurements as shown in Fig. 5d. For the PTVT-T:BTP-eC9 solution, the total concentration was 13.2 mg ml–1 (D:A = 1:1.2) in chloroform with 0.3 vol% diphenyl ether, and the active layers were annealed at 100 °C for 10 min. For the PM6:PY-IT, PM6:PCE13:PY-IT and PM6:PBQx-TF:PY-IT solution, the total concentration was 12 mg ml–1 (D:A = 1:1) in chloroform with 1 vol% 1-chloronaphthalene, and the active layers were annealed at 100 °C for 5 min. For the PM6:BTP-eC9 solution, the total concentration was 15.4 mg ml–1 (D:A = 1:1.2) in chloroform with 0.5 vol% 1,8-diiodooctane, and the active layers were annealed at 100 °C for 1 min. For the PM6:IT-4F solution, the total concentration was 14 mg ml–1 (D:A = 1:1) in chloroform with 0.25 vol% 1,8-diiodooctane, and the active layers were annealed at 100 °C for 1 min. For the PCE10:IEICO-4F solution, the total concentration was 25 mg ml–1 (D:A = 1:1.5) in chlorobenzene with 4 vol% 1-chloronaphthalene. PDINO solution (1.5 mg ml–1) in methanol was then spin-coated on the top of active layers at 3,000 r.p.m. for 60 s to conduct photostability tests. As PDINO is thermally unstable during the encapsulation process, PNDIT-F3N (1.5 mg ml–1 methanol with 0.5% acetic acid solution, 1,500 r.p.m.) was used as the electron transport layer for outdoor experiments. To complete the device fabrication process, 100 nm Ag was evaporated under vacuum conditions of 2 × 10⁻⁶ Torr, yielding a device area of 0.1 cm2. The J–V curves of the aforementioned devices were acquired from a Keithley 2400 source meter unit paired with a PV Measurement Inc. solar simulator. Light intensity dependence, TPC and TPV were conducted on the all-in-one platform of PAIOS (Fluxim). In the light intensity dependence measurement, the light intensities were set as 10.4%, 12.8%, 15.7%, 19.3%, 23.7%, 29.1%, 35.7%, 43.9%, 53.9%, 66.2%, 81.4% and 100.0%. For TPC and TPV measurements, the light-pulse length is 200 μs. The relative pulse intensity is 30% for the TPV measurement.
Stability measurements
The photostability measurements were conducted under the following conditions: a solar simulator was used as the light source, with the temperature and nitrogen atmosphere controlled; the device was loaded under open-circuit conditions. To measure photostability and control the environmental condition, metal chambers with nitrogen flow and a water-cooling system were illuminated under plasma lamp system (Solixon A-70-CU-2 1000 W). Stability data were tracked by a Keithley 2400 source meter unit. To perform thermal stability, devices were first annealed at 110 °C for 10 min to simulate the encapsulation procedure and then degraded at 65 °C in the glovebox. To perform the outdoor measurement, devices were encapsulated following previously reported procedures25, and outdoor stability tests were conducted using the designed equipment, based on our open-source source meter unit µSMU (https://certification.oshwa.org/sa000002.html, calibrated against a Keithley 2400 SMU) under the following conditions (ISOS-O-2)37: encapsulated devices exposed to Saudi Arabian climate, with ambient temperature, and sunlight as the light source; the devices were loaded under open-circuit conditions. Cells were facing south with an angle of 25°, mounted on a rooftop in KAUST at LAT 22.315, LONG 39.109 with a clear view of the sky without shadow. The time interval was set to 10 min.
OFET fabrication and characterizations
Glass substrates were cleaned following the ITO glass cleaning procedures and further treated with oxygen plasma for 3 min to remove any organic compounds remaining on the surface. Afterward, the substrates were transferred to a sputtering chamber for bottom electrodes deposition. The bottom electrodes were sputtered through a shadow mask (100 nm of gold). The polymer solution (7 mg ml–1 in chloroform) was spin-coated onto the pre-cleaned glass substrate at 2,000 r.p.m. for 1 min and thermal annealing at 100 °C for 10 min. After cooling down to room temperature, the Cytop solution was spin-coated on the top of the polymer film at 2,500 r.p.m. for 1 min and thermal annealing at 90 °C for 20 min. Afterward, the substrates were transferred to a thermal evaporation chamber for top gate electrodes deposition (100 nm of Ag). The channel length and width of the OFET devices were from 60, 80 to 100 µm, respectively. For photo-aging procedures, OFET devices were stored in the same metal chamber with nitrogen protection and cooling system as the photostability measurement. The fabricated films were transferred to a probe station connected to a Keithley 4200-SCS in the N2 filled glovebox. For OFET mobility, the transfer curves were recorded using a semiconductor parameter analyser under a nitrogen atmosphere.
SCLC characterization
For preparing hole-only SCLC mobility samples, the deposition conditions of PEDOT:PSS on ITO substrates are the same as mentioned in the device fabrication section. The polymer solution (7 mg ml–1 in chloroform) was spin-coated onto PEDOT:PSS at 3,000 r.p.m. for 1 min and thermal annealing at 100 °C for 10 min. For photo-aging procedures, the substrates were stored in the same metal chamber with nitrogen protection and cooling system as the photostability measurement. Afterward, 10 nm molybdenum oxide and 100 nm silver were thermal evaporated to finish the SCLC devices. A Keithley 2400 source meter unit was used to measure the J–V curves.
Raman and GPC measurements
For Raman measurements, thick neat films of the donor materials were drop-coated on the silicon substrates with a thin gold layer. Photo-aged films were obtained in the same degradation chamber as photostability measurement. Raman measurements were performed on a confocal Raman system that is integrated into the atomic force microscope. For PM6, PCE10, PBDB-T, PBDTTT-E-T and PBDTT-DPP, the wavelength of the excitation laser is 532 nm. For D18, PBQx-TF and PTZ1, the wavelength of the excitation laser is 473 nm. The five monomers (buliding block units in PM6, D18 and PCE10) were aged under the same conditions, and the wavelength of the excitation laser is 633 nm for Raman measurements. Neat films of the donor materials were drop-coated in a 2 ml vial and further photo-aged. For PM6, D18 and PCE10, the fresh and aged films were dissolved using 1,2,4-trichlorobenzene, and filtered to perform the GPC test (150 °C). For PBDTTT-E-T, PBQx-TF, PBDB-T, PTZ1 and PBDTT-DPP, the fresh and aged films were dissolved by chlorobenzene and filtered to perform the GPC test (80 °C).
Computational methods
Unless otherwise specified, all calculations in this work were performed using a B3LYP hybrid functional with a 6–31G(d,p) basis set, and the dispersion corrections for the non-bonding van der Waals interactions were considered through the Grimme approach (DFT-D3 method)63. We first optimized the molecular geometries and then conducted LBO analysis64 (refer to Supplementary Note 3 for a detailed computational procedure). To simulate the Raman spectra, the DFT calculations were performed at the B3LYP/6-311G(d,p) level. All molecular structures were optimized to the energy minimum. To simulate the degradation modes of polymers, the dihedral scans were performed on monomers with an optimized geometry22. In this study, we applied an scaling factor of 0.978 for consistency with experimental data.
GIWAXS and AFM measurements
For GIWAXS measurements, data were acquired using a Xenocs Xeuss 3.0 equipped with a Genix 3D copper source with focused beam collimation, λ = 1.54 Å, and an Eiger2 R 4M detector. The sample to detector distance was 130 mm, and the incidence angle was optimized at 0.16° to probe the full thickness of the film. Each frame was acquired using an exposure of 300 s. Wedge correction and linecut integration were performed using XSACT by Xenocs. Atomic force microscopy measurements were conducted on the films using an Ntegra Prima AFM instrument (NT-MDT) with TESPA cantilevers from Veeco (nominal tip radius 10 nm), and all of the AFM images were recorded in semi-contact mode. All of the films were prepared by following the same conditions as the device fabrication on polished silicon (100) substrates.
GISAXS measurements
PM6:Y6, D18:Y6 and PCE10:Y6 blends were spin-coated onto silicon substrates with the same deposition conditions as mentioned in the ‘Solar cell fabrication and characterizations’ section. For photo-aging procedures, the substrates were stored in the same metal chamber with nitrogen protection and cooling system as the photostability measurement. GISAXS data were acquired using a Xenocs Xeuss v.3.0 instrument equipped with a Genix 3D copper source with parallel beam collimation, λ = 1.54 Å, and an Eiger2 R 4M detector. The sample to detector distance was 1,500 mm, and the incidence angle was optimized at 0.16° to probe the full thickness of the film. Each frame was acquired using an exposure of 10,000 s. Wedge correction and linecut integration was performed using XSACT by Xenocs. The GISAXS fitting analysis is provided in Supplementary Fig. 33.
HR-TEM measurements
PM6:Y6, D18:Y6 and PCE10:Y6 blends coated on the substrates were prepared with the same deposition conditions as mentioned in the ‘Solar cell fabrication and characterizations’ section. For photo-aging procedures, the substrates were stored in the same metal chamber with nitrogen protection and cooling system as the photostability measurement. The desired blend films were then floated onto a copper grid. Images were collected using a Titan 80-300 TEM (Thermo Fisher Scientific) operating at 300 kV, coupled with a 4,000 × 4,000 OneView camera (Gatan).
Mass spectrometry measurements
The gas chromatography mass spectrometry measurements were performed using an Agilent 7890A gas chromatograph operated in electron ionization mode. The injector temperature was maintained at 250 °C, whereas the oven temperature program commenced at 40 °C for 2 min, followed by a ramp to 180 °C at a rate of 20 °C per min, and then to 280 °C at a rate of 50 °C per min. Helium was used as the carrier gas at a flow rate of 1.2 ml per min. The laser desorption/ionization mass spectrometry measurements were performed on an Autoflex Speed mass spectrometer (Bruker, Germany) equipped with the Smartbeam-II laser (355 nm) (see Supplementary Fig. 36 and Supplementary Note 6 for details).
NMR measurements
Proton nuclear magnetic resonance (1H-NMR) spectra were recorded in CDCl3 (298 K) on a Bruker AVIII 500 MHz spectrometer.
UV–vis–NIR absorption coefficient measurements
The absorbance spectra were acquired by adjusting the light beam’s wavelengths within the 300–1,000 nm range using a Perkin Elmer spectrophotometer equipped with an integrating sphere. Film thicknesses were obtained by a P-6 Stylus Profilometer from KLA Tencor.
Reporting summary
Further information on research design is available in the Nature Portfolio Reporting Summary linked to this article.

Journal
Apr. 19, 2025
Journal
Apr. 19, 2025
Journal
Apr. 19, 2025
