• Laser & Optoelectronics Progress
  • Vol. 60, Issue 17, 1706005 (2023)
Yan Mao1,4, Xinglin Tong2,4,*, Shigang Lu3, and Weida Chu2,4
Author Affiliations
  • 1School of Automation, Wuhan University of Technology, Wuhan 430070, Hubei , China
  • 2National Engineering Research Center for Fiber Optic Sensing Technology and Networks, Wuhan University of Technology, Wuhan 430070, Hubei , China
  • 3Materials Genome Institute, Shanghai University, Shanghai 200444, China
  • 4Rizhao Biomedicine and New Materials Research Institute of Wuhan University of Technology, Rizhao 276826, Shandong , China
  • show less
    DOI: 10.3788/LOP221764 Cite this Article Set citation alerts
    Yan Mao, Xinglin Tong, Shigang Lu, Weida Chu. Implantable Fiber Bragg Grating Temperature Sensor Inside Lithium-Ion Battery[J]. Laser & Optoelectronics Progress, 2023, 60(17): 1706005 Copy Citation Text show less
    Sensing principle of FBG
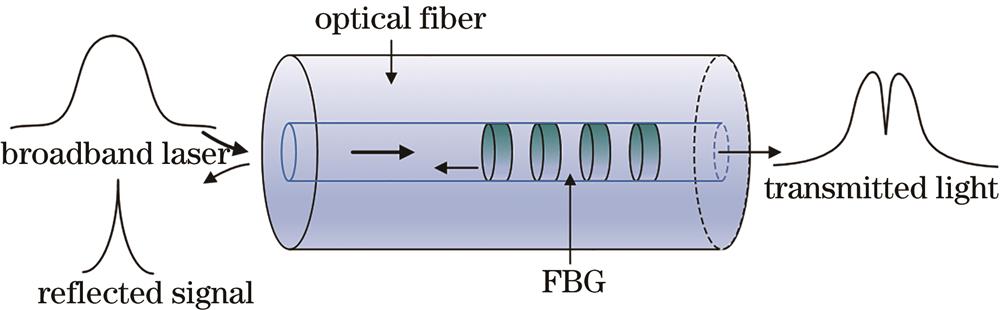
    Fig. 1. Sensing principle of FBG
    Structure diagram of optical fiber F-P air chamber
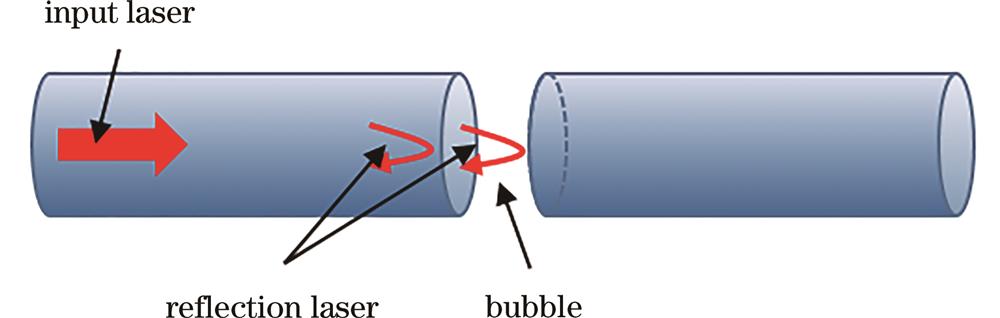
    Fig. 2. Structure diagram of optical fiber F-P air chamber
    Reflection spectrum of FBG composite sensor
    Fig. 3. Reflection spectrum of FBG composite sensor
    Connection relationship of on-line fusion F-P air chamber
    Fig. 4. Connection relationship of on-line fusion F-P air chamber
    Magnified fine images of tiny F-P air chamber. (a) Image saved by optical fiber fusion splicer; (b) CCD microscope image
    Fig. 5. Magnified fine images of tiny F-P air chamber. (a) Image saved by optical fiber fusion splicer; (b) CCD microscope image
    Comparison of F-P interference spectra before and after re-discharge
    Fig. 6. Comparison of F-P interference spectra before and after re-discharge
    Test data fitting for stress relieving
    Fig. 7. Test data fitting for stress relieving
    Schematic diagram of sensor implantation into single lithium-ion battery. (a) Implantation position of sensor; (b) three-dimensional view of sensor after implantation
    Fig. 8. Schematic diagram of sensor implantation into single lithium-ion battery. (a) Implantation position of sensor; (b) three-dimensional view of sensor after implantation
    Test block diagram of implantable sensor experimental system
    Fig. 9. Test block diagram of implantable sensor experimental system
    Temperature and voltage variation curves under different charging currents. (a) Test curve with charging current of 1 A; (b) test curve with charging current of 2 A
    Fig. 10. Temperature and voltage variation curves under different charging currents. (a) Test curve with charging current of 1 A; (b) test curve with charging current of 2 A
    Temperature and voltage variation curves under different discharge rates. (a) Test curve with discharge rate of 1 C; (b) test curve with discharge rate of 2 C
    Fig. 11. Temperature and voltage variation curves under different discharge rates. (a) Test curve with discharge rate of 1 C; (b) test curve with discharge rate of 2 C
    Dependent variable /μεΔλB2 /nmΔλm /nmDependent variable /μεΔλB2 /nmΔλm /nm
    1000.1120.346000.0921.52
    2000.0840.567000.0881.78
    3000.1000.788000.0882.06
    4000.0921.009000.0802.32
    5000.0921.2610000.0802.52
    Table 1. Spectral experimental data
    Yan Mao, Xinglin Tong, Shigang Lu, Weida Chu. Implantable Fiber Bragg Grating Temperature Sensor Inside Lithium-Ion Battery[J]. Laser & Optoelectronics Progress, 2023, 60(17): 1706005
    Download Citation