• Laser & Optoelectronics Progress
  • Vol. 57, Issue 3, 033001 (2020)
Zhiqiang Ning1,2, Jiaxiang Liu2, Yue Wu2, Mengqi Tao2, and Yonghua Fang1,2,*
Author Affiliations
  • 1School of Environment Science and Optoelectronic Technology, University of Science and Technology of China, Hefei, Anhui 230026, China
  • 2Key Laboratory of Environmental Optics and Technology, Anhui Institute of Optics and Fine Mechanics, Chinese Academy of Sciences, Hefei, Anhui 230031, China
  • show less
    DOI: 10.3788/LOP57.033001 Cite this Article Set citation alerts
    Zhiqiang Ning, Jiaxiang Liu, Yue Wu, Mengqi Tao, Yonghua Fang. Infrared Spectrum Baseline Correction Method Based on Improved Iterative Polynomial Fitting[J]. Laser & Optoelectronics Progress, 2020, 57(3): 033001 Copy Citation Text show less
    Flow chart of improved iterative polynomial fitting method
    Fig. 1. Flow chart of improved iterative polynomial fitting method
    Simulation spectrum and the spectrum obtained with the proposed method for the first truncation of the peak
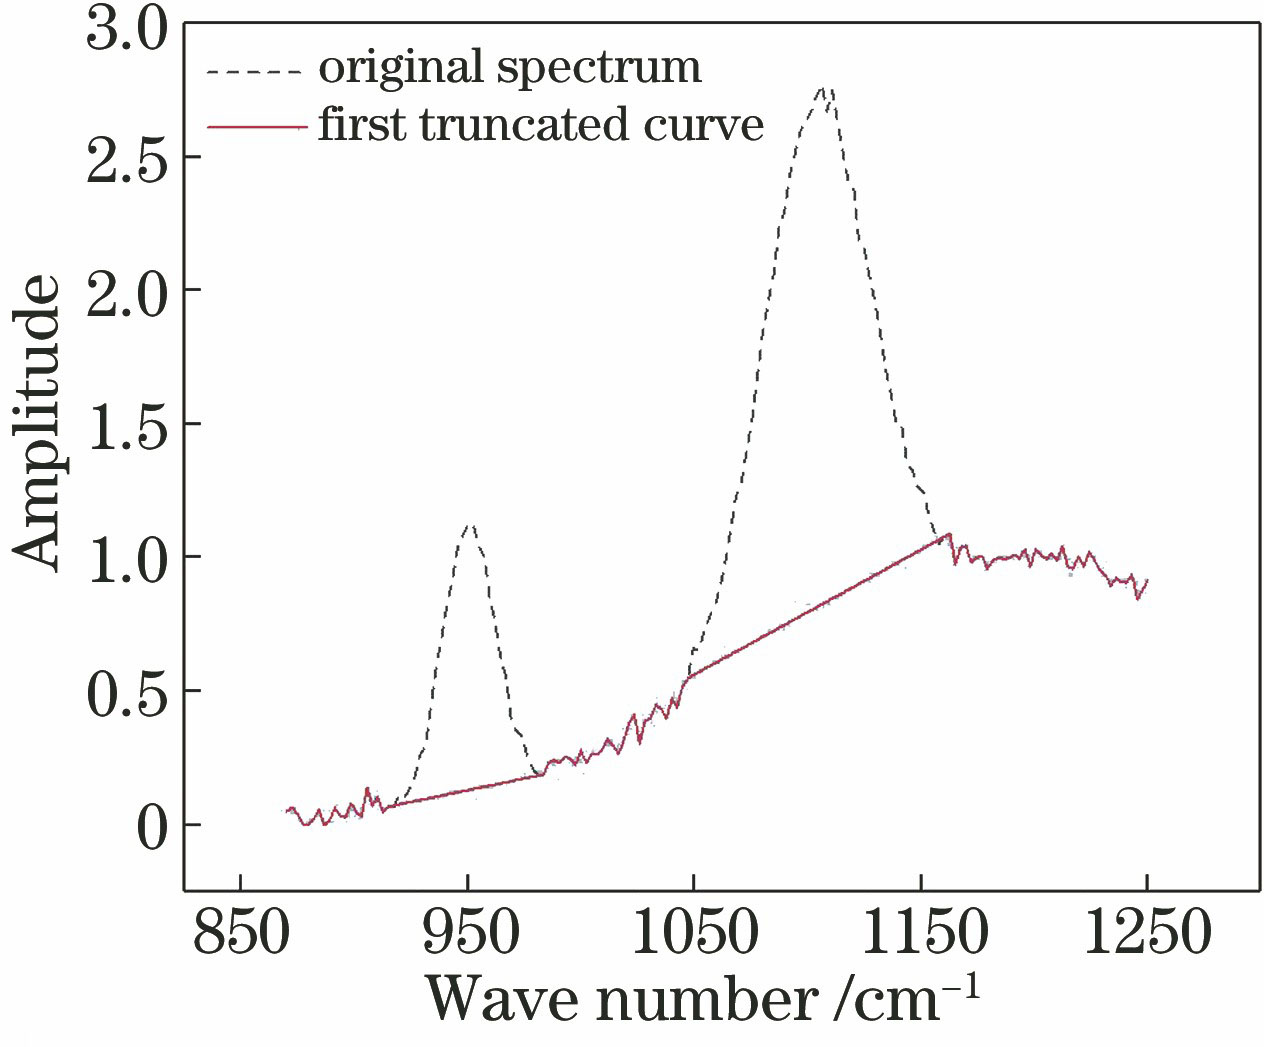
    Fig. 2. Simulation spectrum and the spectrum obtained with the proposed method for the first truncation of the peak
    Simulated spectrum and fitted baseline obtained with different methods
    Fig. 3. Simulated spectrum and fitted baseline obtained with different methods
    Spectra after deducting the baseline
    Fig. 4. Spectra after deducting the baseline
    RMSEs of different methods at different polynomial orders
    Fig. 5. RMSEs of different methods at different polynomial orders
    Original spectrum of trichloroethane and its fitted baselines obtained with different methods
    Fig. 6. Original spectrum of trichloroethane and its fitted baselines obtained with different methods
    Spectra of trichloroethane after baseline correction with different methods
    Fig. 7. Spectra of trichloroethane after baseline correction with different methods
    Original spectrum of ammonia and its fitted baseline obtained with different methods
    Fig. 8. Original spectrum of ammonia and its fitted baseline obtained with different methods
    Spectra of ammonia after baseline correction with different methods
    Fig. 9. Spectra of ammonia after baseline correction with different methods
    Typeabc
    11355
    2210010
    3114050
    Table 1. Simulation parameters of characteristic peak and baseline
    MethodRMSE
    PF0.5081
    IPF0.1694
    BDM0.1258
    Proposed0.0539
    Table 2. RMSEs between the baseline-corrected spectrum and the original spectrum without baseline
    MethodMean RMSE
    PF0.5951
    IPF0.3492
    BDM0.3446
    Proposed0.1108
    Table 3. Mean RMSE of different methods at different polynomial orders
    MethodVariance /10-4
    TrichloroethaneAmmonia
    PF48.240
    IPF11.248
    BDM7.740
    Proposed4.539
    Table 4. Variance of signal after removing characteristic peak
    Zhiqiang Ning, Jiaxiang Liu, Yue Wu, Mengqi Tao, Yonghua Fang. Infrared Spectrum Baseline Correction Method Based on Improved Iterative Polynomial Fitting[J]. Laser & Optoelectronics Progress, 2020, 57(3): 033001
    Download Citation