• Laser & Optoelectronics Progress
  • Vol. 59, Issue 23, 2324001 (2022)
Huaian Yi1,*, Runji Fang1, Aihua Shu2, and Enhui Lu3
Author Affiliations
  • 1School of Mechanical and Control Engineering, Guilin University of Technology, Guilin 541006, Guangxi, China
  • 2School of Foreign Languages, Guilin University of Technology, Guilin 541006, Guangxi, China
  • 3School of Mechanical Engineering, Yangzhou University, Yangzhou 225009, Jiangsu, China
  • show less
    DOI: 10.3788/LOP2022059.2324001 Cite this Article Set citation alerts
    Huaian Yi, Runji Fang, Aihua Shu, Enhui Lu. Milling Surface Roughness Measurement Under Few-Shot Problem[J]. Laser & Optoelectronics Progress, 2022, 59(23): 2324001 Copy Citation Text show less
    GNN network structure diagram
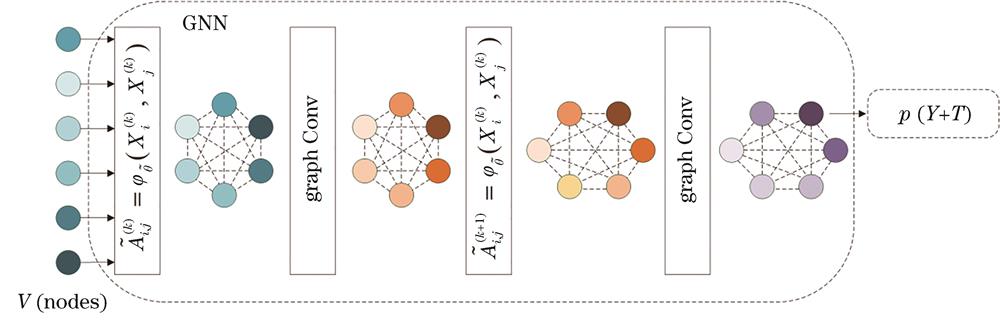
    Fig. 1. GNN network structure diagram
    Partial effect of data enhancement. (a) Original image; (b) adjusting contrast; (c) adjusting saturation; (d) adjusting hue; (e) translation
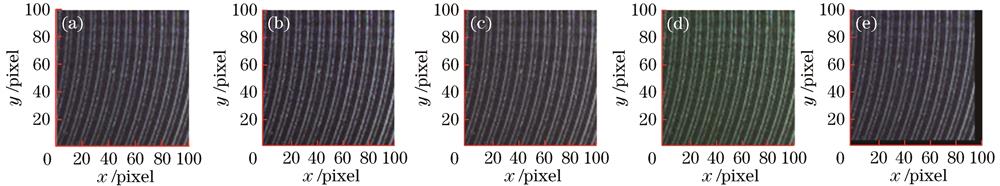
    Fig. 2. Partial effect of data enhancement. (a) Original image; (b) adjusting contrast; (c) adjusting saturation; (d) adjusting hue; (e) translation
    Experimental design flow
    Fig. 3. Experimental design flow
    Machining machine and tool
    Fig. 4. Machining machine and tool
    Experimental setup
    Fig. 5. Experimental setup
    Texture orientation. (a) Left; (b) right
    Fig. 6. Texture orientation. (a) Left; (b) right
    Light and dark uneven distribution and reflection phenomenon
    Fig. 7. Light and dark uneven distribution and reflection phenomenon
    Image pre-processing. (a) Clipping; (b) compression
    Fig. 8. Image pre-processing. (a) Clipping; (b) compression
    Experimental results. Loss function curves and accuracy curves of (a) (b) MAML and (c) (d) GNN
    Fig. 9. Experimental results. Loss function curves and accuracy curves of (a) (b) MAML and (c) (d) GNN
    Experimental results. Loss function curves and accuracy curves for cross-domain detection tasks (a) (b) A to B and (c) (d) B to A
    Fig. 10. Experimental results. Loss function curves and accuracy curves for cross-domain detection tasks (a) (b) A to B and (c) (d) B to A
    MaterialSize /(mm×mm)Roughness range /µmRoughness measuring instrumentNumerical control machine
    45#steel60×400.6-5.0Mitutoyo SJ-301XHS7145
    Milling cutterMilling cutter bladeCutting depth /mmFeed rate /(mm·min-1Spindle speed /(r·min-1
    TAP400R100-32-6TAPMT1604PDER TR3300.05-0.20100-2200700
    Table 1. Material and processing parameters
    SetNumber of samplesData enhancementNumber of samples
    Training set984Yes9840
    Validation set288No
    Test set432No
    Table 3. Sample classification and number statistics after data pre-processing
    NameTraining setValidation setTest set
    A to BABB
    B to ABAA
    Table 4. Cross-domain detection tasks
    Model12345Average
    MAML95.895.695.995.796.095.8
    GNN97.096.997.197.497.097.1
    Table 5. Test accuracy of MAML and GNN
    Name12345Average
    A to B96.796.896.696.696.896.7
    B to A96.496.196.796.396.496.4
    Table 6. Test accuracy of cross-domain detection tasks A to B and B to A