Author Affiliations
1School of Information Science and Engineering, Wuhan University of Science and Technology, Wuhan 430081, Hubei, China2Engineering Research Center for Metallurgical Automation and Measurement Technology, Ministry of Education, Wuhan University of Science and Technology, Wuhan 430081, Hubei, Chinashow less
Fig. 1. Three-branch light field depth estimation network
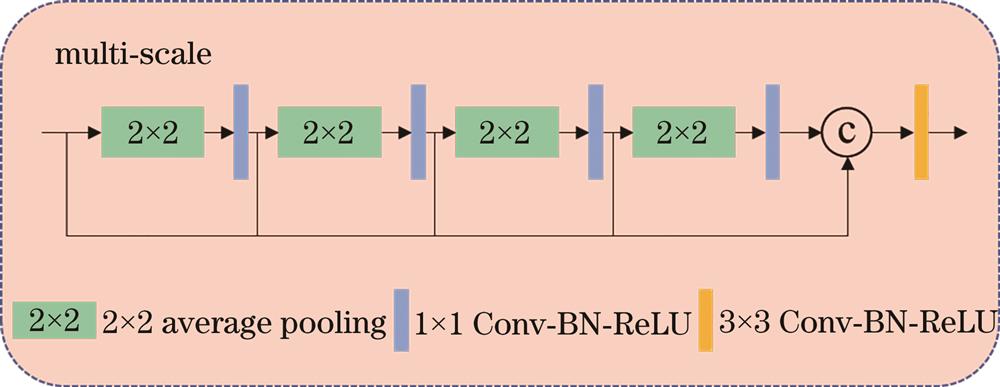
Fig. 2. Multi-scale feature extraction module
Fig. 3. Data augmentation by rotation
Fig. 4. Convergence curve of network training
Fig. 5. Comparison of the data results of each method on the test set. (a) MAE; (b) BP7; (c) BP5; (d) BP3
Fig. 6. Comparison of depth map results of various methods. (a) CAE; (b) OCC; (c) SPO; (d)REFOCUS; (e) EPINet; (f) proposed method; (g) ground-truth
Fig. 7. Comparison of error maps of the proposed method and EPINet
Fig. 8. Comparison of depth map results of the proposed network with/without center view
Fig. 9. Comparison of error map results of the proposed network with/without center view
| Method | Scene 1 | Scene 8 | Scene 24 |
|---|
| MAE /102 | BP7 /% | BP5 /% | BP3 /% | MAE /102 | BP7 /% | BP5 /% | BP3 /% | MAE /102 | BP7 /% | BP5 /% | BP3 /% |
|---|
| CAE | 34.86 | 1.371 | 1.666 | 1.959 | 29.09 | 0.668 | 0.864 | 1.122 | 78.29 | 4.769 | 5.187 | 5.952 | | OCC | 77.36 | 2.498 | 3.923 | 5.282 | 69.50 | 1.295 | 2.362 | 4.051 | 88.43 | 4.131 | 5.618 | 9.697 | | SPO | 145.38 | 1.002 | 18.430 | 18.430 | 194.36 | 1.581 | 28.213 | 53.186 | 90.13 | 0.947 | 2.634 | 11.222 | | REFOCUS | 91.42 | 4.710 | 6.350 | 8.489 | 68.36 | 1.761 | 3.289 | 5.437 | 89.05 | 4.980 | 6.424 | 9.599 | | EPINet | 16.99 | 0.021 | 0.052 | 0.193 | 15.26 | 0.013 | 0.056 | 0.206 | 19.79 | 0.191 | 0.383 | 0.858 | | Proposed method | 17.66 | 0.043 | 0.091 | 0.091 | 18.11 | 0.015 | 0.055 | 0.183 | 20.72 | 0.187 | 0.380 | 0.815 | | Method | Scene 38 | Scene 40 | Scene 55 | | MAE /102 | BP7 /% | BP5 /% | BP3 /% | MAE /102 | BP7 /% | BP5 /% | BP3 /% | MAE /102 | BP7 /% | BP5 /% | BP3 /% | | CAE | 31.63 | 1.127 | 1.290 | 1.544 | 25.76 | 0.927 | 1.108 | 1.388 | 31.74 | 0.886 | 1.094 | 1.415 | | OCC | 82.35 | 2.218 | 4.930 | 7.082 | 68.27 | 2.990 | 4.712 | 5.893 | 78.64 | 1.630 | 3.252 | 5.793 | | SPO | 140.89 | 0.785 | 19.203 | 32.404 | 110.02 | 1.025 | 19.219 | 28.477 | 198.86 | 1.006 | 28.920 | 55.598 | | REFOCUS | 81.27 | 3.615 | 5.396 | 6.995 | 97.72 | 7.074 | 8.846 | 10.340 | 75.81 | 2.605 | 4.483 | 7.101 | | EPINet | 22.34 | 0.071 | 0.156 | 0.409 | 19.02 | 0.055 | 0.147 | 0.370 | 17.30 | 0.024 | 0.066 | 0.252 | | Proposed method | 22.76 | 0.091 | 0.170 | 0.384 | 16.29 | 0.057 | 0.145 | 0.400 | 19.43 | 0.027 | 0.078 | 0.239 | | Method | Scene 58 | Scene 69 | Scene 86 | | MAE /102 | BP7 /% | BP5 /% | BP3 /% | MAE /102 | BP7 /% | BP5 /% | BP3 /% | MAE /102 | BP7 /% | BP5 /% | BP3 /% | | CAE | 29.82 | 0.965 | 1.120 | 1.345 | 35.05 | 1.254 | 1.394 | 1.650 | 25.94 | 0.665 | 0.827 | 1.115 | | OCC | 82.84 | 1.976 | 4.499 | 6.174 | 67.74 | 1.819 | 2.902 | 4.330 | 74.92 | 1.812 | 3.910 | 5.661 | | SPO | 208.54 | 1.248 | 38.245 | 56.931 | 192.19 | 1.125 | 30.187 | 52.479 | 189.23 | 1.021 | 32.608 | 51.655 | | REFOCUS | 77.55 | 3.202 | 5.779 | 7.803 | 73.69 | 3.289 | 5.175 | 7.853 | 82.28 | 3.397 | 5.688 | 8.005 | | EPINet | 19.47 | 0.040 | 0.109 | 0.249 | 15.28 | 0.080 | 0.142 | 0.336 | 16.97 | 0.023 | 0.065 | 0.197 | | Proposed method | 22.29 | 0.055 | 0.118 | 0.282 | 17.68 | 0.077 | 0.142 | 0.332 | 19.33 | 0.018 | 0.064 | 0.191 |
|
Table 1. Comparison of objective metrics of different algorithms in different scenes
| Method | MAE /102 | BP7 /% | BP5 /% | BP3 /% |
|---|
| CAE | 34.9138 | 1.1345 | 1.3402 | 1.6896 | | OCC | 74.1117 | 1.9221 | 3.5428 | 5.4535 | | SPO | 161.6611 | 0.9002 | 22.5860 | 40.8998 | | REFOCUS | 78.2058 | 3.4325 | 5.1551 | 7.2922 | | EPINet | 18.1747 | 0.0648 | 0.1396 | 0.3362 | | Proposed method | 19.7986 | 0.0885 | 0.1591 | 0.3551 |
|
Table 2. Comparison of average objective metrics of different algorithms
| Method | Average time/s | Number of parameters |
|---|
| CAE | 806.5161 | | | OCC | 19.3286 | | | SPO | 283.0965 | | | REFOCUS | 166.4036 | | | EPINet | 0.5533 | 5,124,281 | | Proposed method | 0.2282 | 1,402,065 |
|
Table 3. Efficiency comparison of different algorithms
| Method | MAE /102 | BP7 /% | BP5 /% | BP3 /% |
|---|
| Proposed method(without center view) | 41.4286 | 0.0894 | 0.1702 | 0.3657 | | Proposed method(with center view) | 19.7986 | 0.0885 | 0.1591 | 0.3551 |
|
Table 4. Comparison of average objective metrics of the proposed network with/without center view