
Kaiyuan Zheng, Yaoen Luo, Yi Zhang, Cong Chen. Progress in Laser Direct Deposition of Inconel 718 Alloy[J]. Laser & Optoelectronics Progress, 2022, 59(23): 2300001
- Laser & Optoelectronics Progress
- Vol. 59, Issue 23, 2300001 (2022)
![Schematic process principle of conventional laser direct deposition and high-speed laser direct deposition[5]](/richHtml/lop/2022/59/23/2300001/img_01.jpg)
Fig. 1. Schematic process principle of conventional laser direct deposition and high-speed laser direct deposition[5]
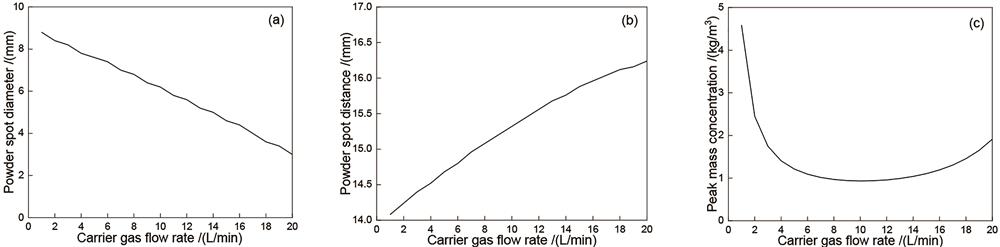
Fig. 2. Influence of carrier gas flow rate on powder beam convergence characteristics. (a) Powder spot diameter; (b) powder spot distance; (c) peak mass concentration of powder
Fig. 3. Influence of powder feed rate on powder beam convergence characteristics. (a) Powder spot diameter; (b) powder spot distance; (c) peak mass concentration of powder
Fig. 4. Comparison of single-pass deposition layers with different process parameters under constant heat input and mass energy[13]. (a) P = 400 W, v = 400 mm/min; (b) P = 500 W, v = 500 mm/min; (c) P = 750 W, v =750 mm/min; (d) P = 900 W, v = 900 mm/min
Fig. 5. 3D profiles of laser direct deposition surfaces [15]. (a) P = 400 W, v = 0.2 m/min; (b) P = 500 W, v = 0.4 m/min
Fig. 6. Change of microstructure of sedimentary layer with laser power[26]. (a) Bonding zone; (b) deposition zone
Fig. 7. Change of microstructure of sedimentary layer with scanning speed[26]. (a) Bonding zone; (b) deposition zone
Fig. 8. Morphology of Laves phase particles[32]. (a) 1 kW; (b) 3.5 kW
Fig. 9. Section morphology of massive deposition samples under different laser powers and scanning speeds[13].(a) P=400 W, v=400 mm/min; (b) P=500 W, v=500 mm/min; (c) P=750 W, v=750 mm/min; (d) P=900 W, v=900 mm/min
Fig. 10. Cross section and hot crack of additive alloy with different laser scanning speed and heat input[22].(a) 2 mm/s, 500 J/mm; (b) 3 mm/s, 500 J/mm; (c) 4 mm/s, 500 J/mm; (d) 5 mm/s, 500 J/mm; (e) 6 mm/s, 500 J/mm; (f) 5 mm/s, 300 J/mm; (g) 5 mm/s, 400 J/mm; (h) 5 mm/s, 560 J/mm; (i) 5 mm/s, 600 J/mm
Fig. 11. Thermal cracks in long chain Laves phase in Inconel 718 deposited samples[32]
Fig. 12. Curve of hardness change[37]. (a) Different laser powers; (b) different scanning speeds
Fig. 13. Macroscopic morphology of section of sediment layer[41]. (a) High-speed laser cladding; (b) conventional laser cladding
Fig. 14. Macro morphology and surface detection of sediment layer[52]. (a) Conventional laser cladding; (b) high-speed laser cladding
Fig. 15. Microstructure of high-speed laser cladding deposition layer and traditional laser cladding deposition layer[48]. (a) High-speed laser cladding; (b) conventional laser cladding
Fig. 16. EBSD results of high-speed laser cladding K648 superalloy deposition layer[49]
Fig. 17. Hardness distribution of high-speed laser cladding and conventional laser cladding layer[52]
|
Table 1. Comparison of process parameters and microstructure properties between conventional laser direct deposition and high-speed laser direct deposition[4]


Set citation alerts for the article
Please enter your email address

© Copyright 2018-2021 | Chinese Laser Press. All Rights Reserved 沪ICP备15018463号-20