
Shichong Fu, Dan Zhang, Qun Luo. Leakage Identification and Localization Method for Gas Transmission Pipeline Based on Distributed Acoustic Sensing[J]. Laser & Optoelectronics Progress, 2025, 62(3): 0306003
- Laser & Optoelectronics Progress
- Vol. 62, Issue 3, 0306003 (2025)
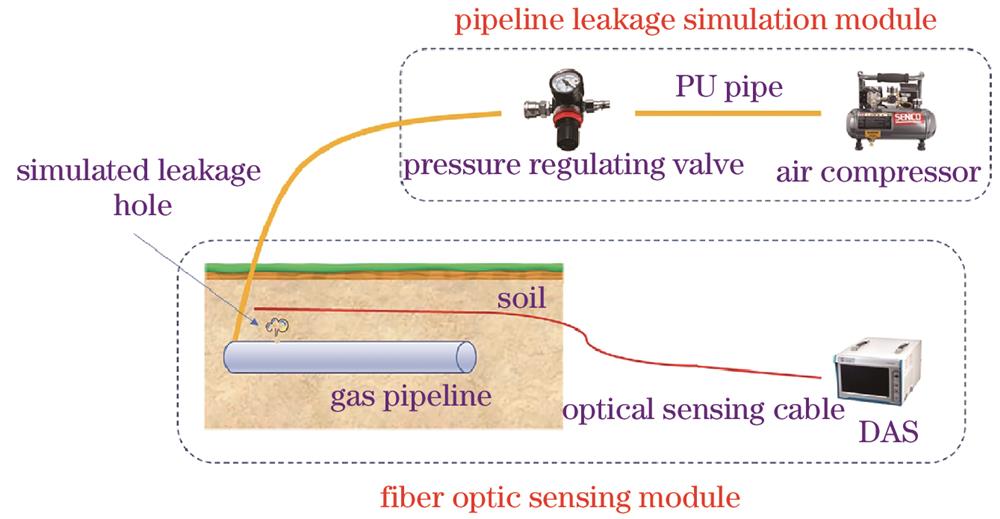
Fig. 1. Schematic diagram of the gas leakage simulation
![Schematic diagram of the optical sensing cable with a spiral structure[20]](/richHtml/lop/2025/62/3/0306003/img_02.jpg)
Fig. 2. Schematic diagram of the optical sensing cable with a spiral structure[20]
Fig. 3. Image of pipeline leakage hole
Fig. 4. Relative position diagram of optical sensing cable and pipeline
Fig. 5. Time-domain intensity change curves of the sensing channel near the leak point
Fig. 6. Time-domain intensity change curves of background noise and leakage signal
Fig. 7. Comparison of frequency spectra between leakage signal and background noise
Fig. 8. STFT results of background noise and leakage signal (0‒15 s is background noise, 15‒30 s is leakage signal)
Fig. 9. Comparison of frequency spectra between background noise and leakage signal when leakage distance is 12 cm
Fig. 10. STFT result of time-averaged DAS signal
Fig. 11. Schematic diagram of leakage location in gas transmission pipeline
Fig. 12. Spectral average amplitude distribution of each sensing channel
Fig. 13. Comparison of spectra between the 6th sensing channel and the 8th sensing channel
Fig. 14. Distribution of correlation coefficient between the 6th sensing channel and the 8th sensing channel
Fig. 15. Cross-correlation result between the 6th sensing channel and the 8th sensing channel
|
Table 1. Results of leakage precision location


Set citation alerts for the article
Please enter your email address

© Copyright 2018-2021 | Chinese Laser Press. All Rights Reserved 沪ICP备15018463号-20