• Remote Sensing Technology and Application
  • Vol. 39, Issue 2, 350 (2024)
Qianyue ZHANG1,*, Jizhen ZHANG2, Xinyao HAO1, and Yue ZHANG1,3,4
Author Affiliations
  • 1College of Resources and Environment,Jilin Agricultural University,Changchun 130118,China
  • 2Songliao Water Conservancy Commission Songliao Basin Soil and Water Conservation Monitoring Center Station,Changchun 130021,China
  • 3Key Laboratory of Sustainable Utilization for Jilin Province Commercial Grain Bases,Jilin Agricultural University,Changchun 130118,China
  • 4Key Laboratory of Straw Comprehensive Utilization and Black Soil Conservation,Ministry of Education. Changchun 130118,China
  • show less
    DOI: 10.11873/j.issn.1004-0323.2024.2.0350 Cite this Article
    Qianyue ZHANG, Jizhen ZHANG, Xinyao HAO, Yue ZHANG. Monitoring Farmland Phenology Changes of Northeast China and Their Response to Climate in Early 21st Century[J]. Remote Sensing Technology and Application, 2024, 39(2): 350 Copy Citation Text show less
    Location of the study area and climate stations
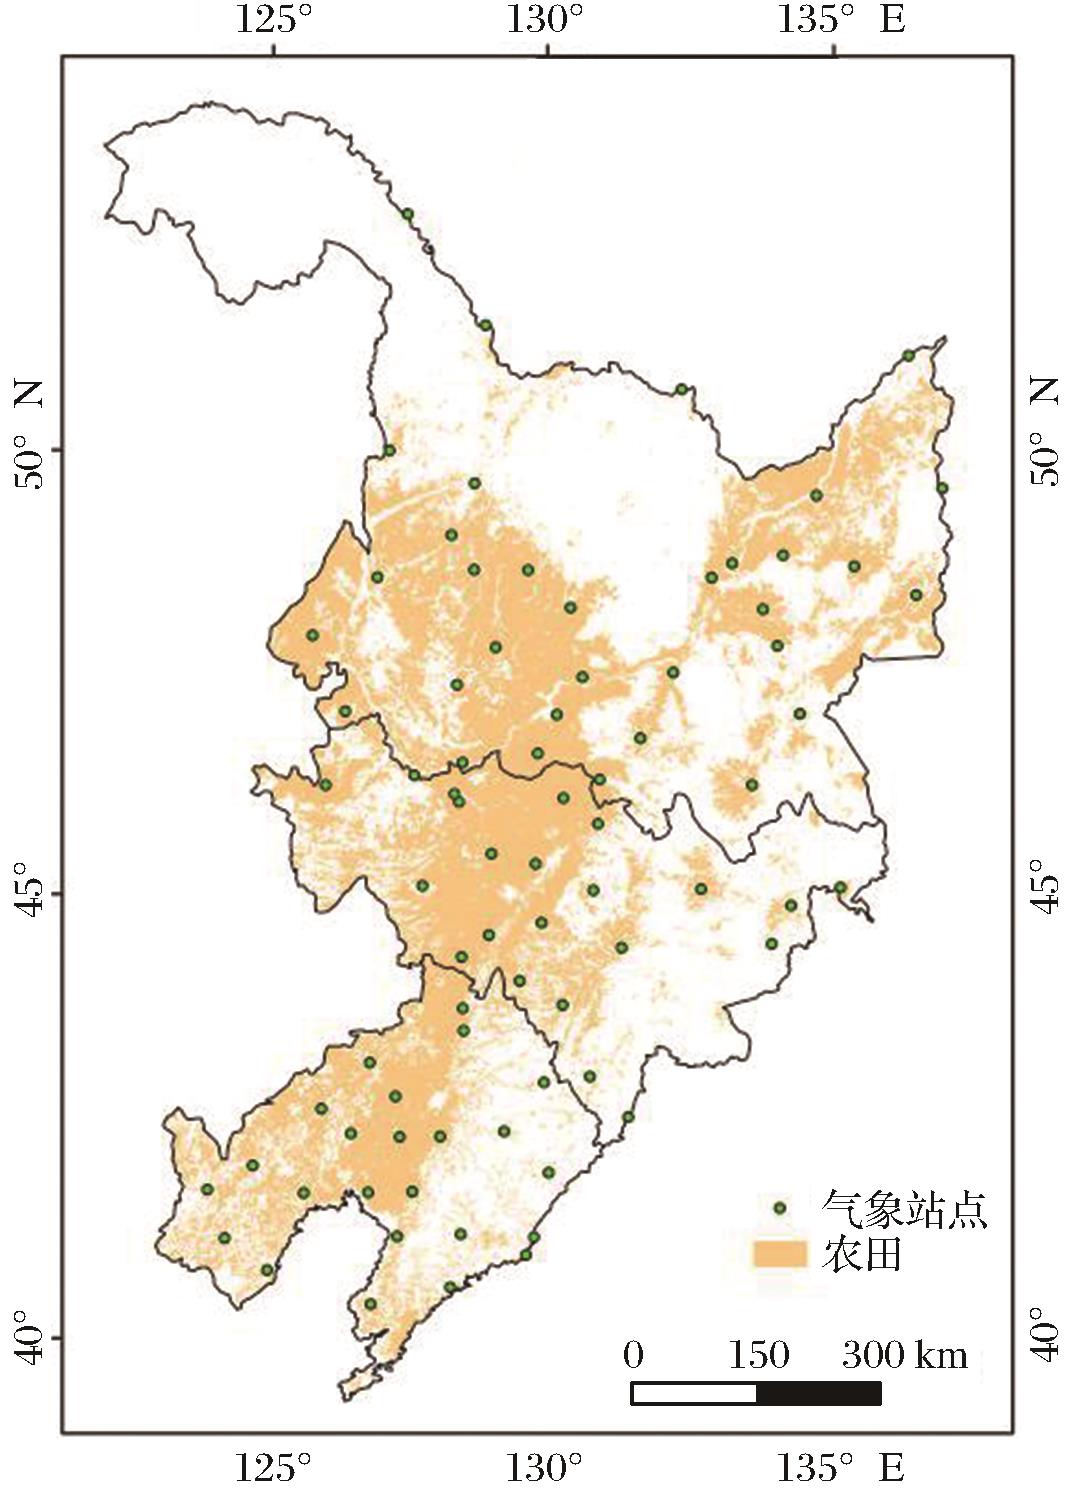
    Fig. 1. Location of the study area and climate stations
    Spatial distribution of farmland phenology (SOS, EOS and LOS) during 2005~2020 in NEC
    Fig. 2. Spatial distribution of farmland phenology (SOS, EOS and LOS) during 2005~2020 in NEC
    Temporal patterns of farmland phenology (SOS, EOS and LOS) during 2005~2020 in NEC
    Fig. 3. Temporal patterns of farmland phenology (SOS, EOS and LOS) during 2005~2020 in NEC
    Interannual variation of farmland phenology (SOS, EOS and LOS) in NEC during 2005 to 2020
    Fig. 4. Interannual variation of farmland phenology (SOS, EOS and LOS) in NEC during 2005 to 2020
    Changes of the cropping structure during 2005-2020 in NEC.
    Fig. 5. Changes of the cropping structure during 2005-2020 in NEC.
    Temporal patterns of the NEC farmland phenology of cropping structure changing zone during 2005~2020
    Fig. 6. Temporal patterns of the NEC farmland phenology of cropping structure changing zone during 2005~2020
    Temperature effects on farmland phenology of NEC during 2005~2020
    Fig. 7. Temperature effects on farmland phenology of NEC during 2005~2020
    Precipitation effects on farmland phenology of NEC during 2005~2020
    Fig. 8. Precipitation effects on farmland phenology of NEC during 2005~2020
    Sunshine hours effects on farmland phenology of NEC during 2005~2020
    Fig. 9. Sunshine hours effects on farmland phenology of NEC during 2005~2020
    遥感物候期参数名称定义

    对应农业

    物候期名称

    定义参考文献
    生长季开始光合作用开始、绿叶面积开始上升的时期出苗期幼苗出土的前后时期

    王敏钰等,

    2022[3]

    生长季结束光合作用接近于0、绿叶面积降级至最小值的时期成熟期作物收获时期/作物叶片或茎杆发生规律性单调变化
    生长季长度生长季开始和结束期之间的时间长度
    Table 1. Correspondence between remote sensing phenological parameters and traditional phenological observational time nodes
    生长季开始日期生长季结束日期生长季长度
    r0.650.580.63
    RMSE (d)6.57.16.6
    Table 2. Validation results of the farmland phenology(SOS、EOS、LOS)
    气温降水日照时数
    正相关负相关正相关负相关正相关负相关
    SOS9.8032.094.2655.657.515.63
    EOS5.2342.8535.0214.376.7830.76
    LOS7.1534.3637.6616.348.625.00
    Table 3. The percentage of correlation coefficients (*p<0.05) between phenology dates and temperature, precipitation and sunshine hours at climate stations/%
    Qianyue ZHANG, Jizhen ZHANG, Xinyao HAO, Yue ZHANG. Monitoring Farmland Phenology Changes of Northeast China and Their Response to Climate in Early 21st Century[J]. Remote Sensing Technology and Application, 2024, 39(2): 350
    Download Citation