• Laser & Optoelectronics Progress
  • Vol. 60, Issue 12, 1210003 (2023)
Biao Wang, Shaojun Lin*, and Weiwei Zhao
Author Affiliations
  • School of Electronics and Control Engineering, Chang'an University, Xi'an 710054, Shaanxi, China
  • show less
    DOI: 10.3788/LOP221059 Cite this Article Set citation alerts
    Biao Wang, Shaojun Lin, Weiwei Zhao. Quantum Derived Image Transformation and Threshold Denoising Algorithm[J]. Laser & Optoelectronics Progress, 2023, 60(12): 1210003 Copy Citation Text show less
    Schematic of image as discrete potential field
    Fig. 1. Schematic of image as discrete potential field
    Characteristic diagram of wave function. (a) Wave function of constant potential field; (b) wave function of inhomogeneous potential field
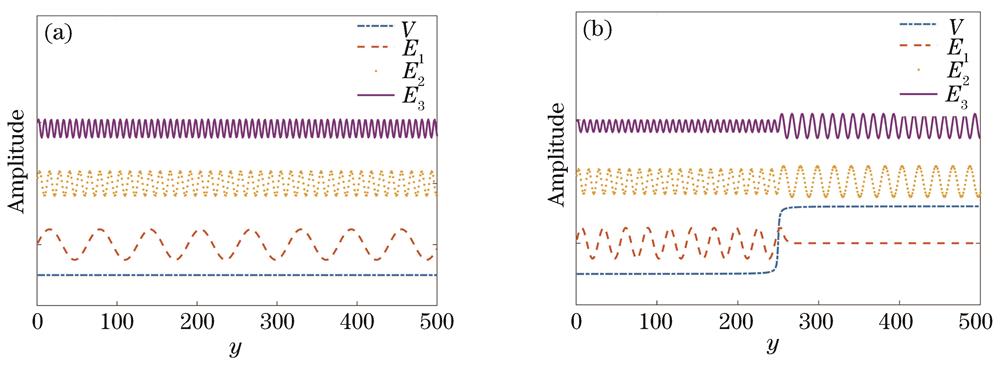
    Fig. 2. Characteristic diagram of wave function. (a) Wave function of constant potential field; (b) wave function of inhomogeneous potential field
    Noisy image and corresponding wave function ψE20. (a) Original image; (b) Poisson noise with peak of 10;(c)delocalization;(d)-(f)corresponding wave functions ψE20
    Fig. 3. Noisy image and corresponding wave function ψE20. (a) Original image; (b) Poisson noise with peak of 10;(c)delocalization;(d)-(f)corresponding wave functions ψE20
    Distribution diagram of projection coefficient
    Fig. 4. Distribution diagram of projection coefficient
    Threshold function curve. (a) Traditional soft threshold function; (b) threshold scale factor
    Fig. 5. Threshold function curve. (a) Traditional soft threshold function; (b) threshold scale factor
    Image denoising effect under different ℏ2/2m (top) and details (bottom)
    Fig. 6. Image denoising effect under different 2/2m (top) and details (bottom)
    Image denoising effect under different σ2 (top) and details (bottom)
    Fig. 7. Image denoising effect under different σ2 (top) and details (bottom)
    Denoising effect under Gaussian noise with mean value of 0 and variance of 0.01. (a) Original image; (b) noisy image; (c) SCSA; (d) WHT; (e) WST; (f) TV1; (g) NLM; (h) proposed algorithm
    Fig. 8. Denoising effect under Gaussian noise with mean value of 0 and variance of 0.01. (a) Original image; (b) noisy image; (c) SCSA; (d) WHT; (e) WST; (f) TV1; (g) NLM; (h) proposed algorithm
    Denoising effect under Gaussian noise with mean value of 0 and variance of 0.005. (a) Original image; (b) noisy image; (c) SCSA; (d) WHT; (e) WST; (f) TV1; (g) NLM; (h) proposed algorithm
    Fig. 9. Denoising effect under Gaussian noise with mean value of 0 and variance of 0.005. (a) Original image; (b) noisy image; (c) SCSA; (d) WHT; (e) WST; (f) TV1; (g) NLM; (h) proposed algorithm
    Denoising effect under Poisson noise with peak value of 100. (a) Lena; (b) noisy image; (c) PURE-LET; (d) AWHT; (e) TV2; (f) FOTV; (g) ANLM; (h) proposed algorithm
    Fig. 10. Denoising effect under Poisson noise with peak value of 100. (a) Lena; (b) noisy image; (c) PURE-LET; (d) AWHT; (e) TV2; (f) FOTV; (g) ANLM; (h) proposed algorithm
    Denoising effect under Poisson noise with peak value of 10. (a) house; (b) noisy image; (c) PURE-LET; (d) AWHT; (e) TV2; (f) FOTV; (g) ANLM; (h) proposed algorithm
    Fig. 11. Denoising effect under Poisson noise with peak value of 10. (a) house; (b) noisy image; (c) PURE-LET; (d) AWHT; (e) TV2; (f) FOTV; (g) ANLM; (h) proposed algorithm
    Noise typeNoise intensityWHTWSTSCSATV1NLMProposed algorithm
    Gaussian0.005 variance0.050.045.913.7533.020.27
    noise0.01 variance0.070.096.054.2334.100.54
    Poissonppeak=100.890.2813.8911.6435.750.58
    noiseppeak=1001.570.2111.229.2334.260.25
    Table 1. Operation time of different algorithms
    ImageAlgorithmGaussian noise(0.005 variance)Gaussian noise(0.01 variance)
    MSEPSNR /dBSSIMMSEPSNR /dBSSIM
    LenaNoisy image0.005023.030.460.010020.010.34
    WHT0.001728.640.740.002625.840.72
    WST0.001528.180.770.002526.010.71
    SCSA0.001926.820.730.003124.900.60
    TV10.001029.100.800.001627.550.75
    NLM0.001029.020.860.001428.250.81
    Proposed algorithm0.001628.070.760.002526.250.71
    cameramanNoisy image0.005023.340.440.010020.360.34
    WHT0.001528.110.740.002425.860.68
    WST0.001327. 960.750.002325.760.67
    SCSA0.001725.980.640.002824.180.57
    TV10.001428.520.800.001827.260.73
    NLM0.001627.990.830.002027.010.76
    Proposed algorithm0.001328.150.750.002426.150.69
    Table 2. Comparison of denoising effect (Gaussian noise)
    ImageAlgorithmPoisson noise(ppeak=10)Poisson noise(ppeak=100)
    MSEPSNR /dBSSIMMSEPSNR /dBSSIM
    houseNoisy image0.041513.820.120.005018.130.39
    PURE-LET0.004523.670.500.001029.130.72
    AWHT0.003824.680.490.000929.430.73
    TV20.003324.760.580.001129.250.76
    FOTV0.002725.510.630.000730.120.81
    ANLM0.003424.470.640.000532.580.85
    Proposed algorithm0.002925.370.600.001030.050.79
    LenaNoisy image0.039813.990.170.004623.360.49
    PURE-LET0.004923.150.530.001927.730.78
    AWHT0.004523.790.530.001727.970.79
    TV20.003624.130.620.001429.270.80
    FOTV0.003324.650.680.001030.110.85
    ANLM0.003824.080.640.000930.190.87
    Proposed algorithm0.003424.920.650.001229.630.83
    Table 3. Comparison of denoising effect (Poisson noise)