• Laser & Optoelectronics Progress
  • Vol. 60, Issue 13, 1314004 (2023)
Hao Zhang1,2,3, Yaqing Hou2, Yazhou He1,2, Haohao Kong1,2..., Fafa Li2 and Hang Su2,*|Show fewer author(s)
Author Affiliations
  • 1Central Iron & Steel Research Institute, Beijing 100081, China
  • 2Material Digital R & D Center, CISRI Group, Beijing 100081, China
  • 3Andron (Chongqing) Material Technology Co., Ltd., Chongqing 401329, China
  • show less
    DOI: 10.3788/LOP230764 Cite this Article Set citation alerts
    Hao Zhang, Yaqing Hou, Yazhou He, Haohao Kong, Fafa Li, Hang Su. Influence of Cr Content on the Microstructure and Properties of Laser Powder Bed Fusion FeCr Alloy[J]. Laser & Optoelectronics Progress, 2023, 60(13): 1314004 Copy Citation Text show less
    SEM morphologies of powders. (a) Fe powder; (b) Cr powder
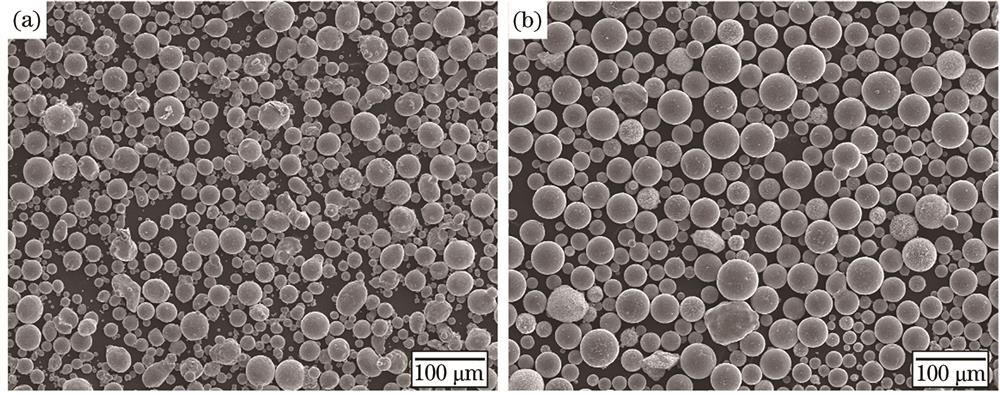
    Fig. 1. SEM morphologies of powders. (a) Fe powder; (b) Cr powder
    Schematic diagram of the high throughput synthesis platform
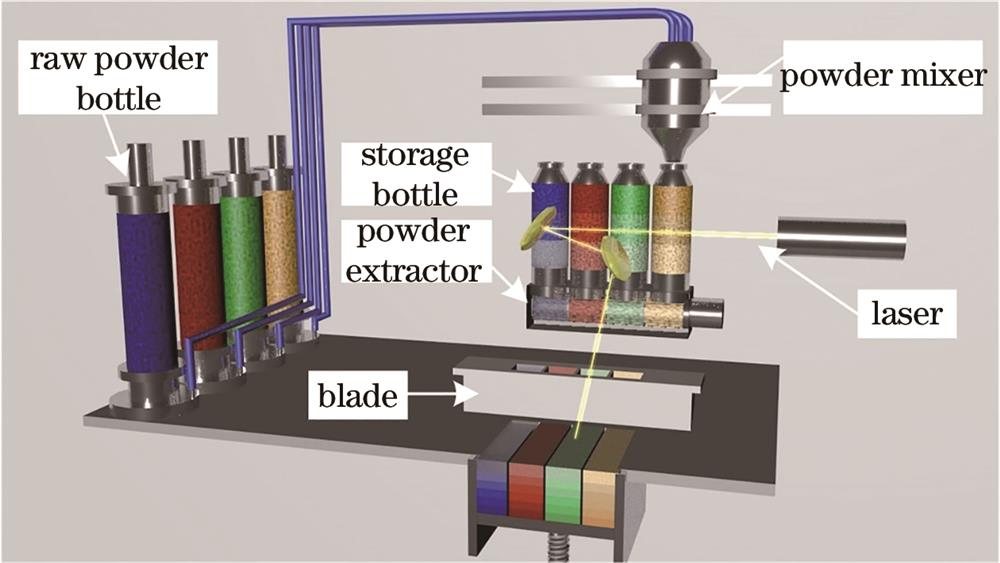
    Fig. 2. Schematic diagram of the high throughput synthesis platform
    Fe-Cr alloy samples. (a) Photo of FeCr gradient composition sample; (b) laser scanning strategy time
    Fig. 3. Fe-Cr alloy samples. (a) Photo of FeCr gradient composition sample; (b) laser scanning strategy time
    μ-XRF results of FeCr gradient composition samples. (a) Cr element mass fraction; (b) deviation of Cr element mass fraction
    Fig. 4. μ-XRF results of FeCr gradient composition samples. (a) Cr element mass fraction; (b) deviation of Cr element mass fraction
    XRD patterns of FeCr gradient composition specimens
    Fig. 5. XRD patterns of FeCr gradient composition specimens
    OM morphology of FeCr gradient composition specimens. (a) Sample cross section; (b) pure iron; (c) Fe2Cr; (d) Fe4Cr; (e) Fe6Cr; (f) Fe8Cr; (g) Fe10Cr; (h) Fe12Cr; (i) Fe14Cr; (j) Fe16Cr; (k) Fe18Cr; (l) Fe20Cr
    Fig. 6. OM morphology of FeCr gradient composition specimens. (a) Sample cross section; (b) pure iron; (c) Fe2Cr; (d) Fe4Cr; (e) Fe6Cr; (f) Fe8Cr; (g) Fe10Cr; (h) Fe12Cr; (i) Fe14Cr; (j) Fe16Cr; (k) Fe18Cr; (l) Fe20Cr
    OM morphology at high magnification from pure Fe to Fe10Cr. (a) Pure Fe; (b) Fe2Cr; (c) Fe4Cr; (d) Fe6Cr; (e) Fe8Cr; (f) Fe10Cr
    Fig. 7. OM morphology at high magnification from pure Fe to Fe10Cr. (a) Pure Fe; (b) Fe2Cr; (c) Fe4Cr; (d) Fe6Cr; (e) Fe8Cr; (f) Fe10Cr
    Thermal conductivity of FeCr alloy with different Cr element mass fractions
    Fig. 8. Thermal conductivity of FeCr alloy with different Cr element mass fractions
    Phase diagram of FeCr binary alloy
    Fig. 9. Phase diagram of FeCr binary alloy
    Microhardness of specimens with FeCr gradient composition
    Fig. 10. Microhardness of specimens with FeCr gradient composition
    MaterialD10 /μmD50 /μmD90 /μmAverage powder size /μm
    Fe11.9928.4851.1026.82
    Cr24.4239.3665.5338.09
    Table 1. Powder particle size distribution
    Hao Zhang, Yaqing Hou, Yazhou He, Haohao Kong, Fafa Li, Hang Su. Influence of Cr Content on the Microstructure and Properties of Laser Powder Bed Fusion FeCr Alloy[J]. Laser & Optoelectronics Progress, 2023, 60(13): 1314004
    Download Citation