• Laser & Optoelectronics Progress
  • Vol. 60, Issue 12, 1210024 (2023)
Zhiqiang Zhou1, Xin Wang1,2,*, Tian Yang1, Hao Cui1, and Jun Gao1
Author Affiliations
  • 1School of Computer and Information, Hefei University of Technology, Hefei 230601, Anhui, China
  • 2Intelligent Interconnected Systems Laboratory of Anhui Province, Hefei 230601, Anhui, China
  • show less
    DOI: 10.3788/LOP221968 Cite this Article Set citation alerts
    Zhiqiang Zhou, Xin Wang, Tian Yang, Hao Cui, Jun Gao. Algorithm of Target Enhancement Under Shadow that Combining Polarization Distance and Color Space[J]. Laser & Optoelectronics Progress, 2023, 60(12): 1210024 Copy Citation Text show less
    Model of a bionic four-channel
    Fig. 1. Model of a bionic four-channel
    Mapping improvement program. (a) HSI model; (b) PDI model
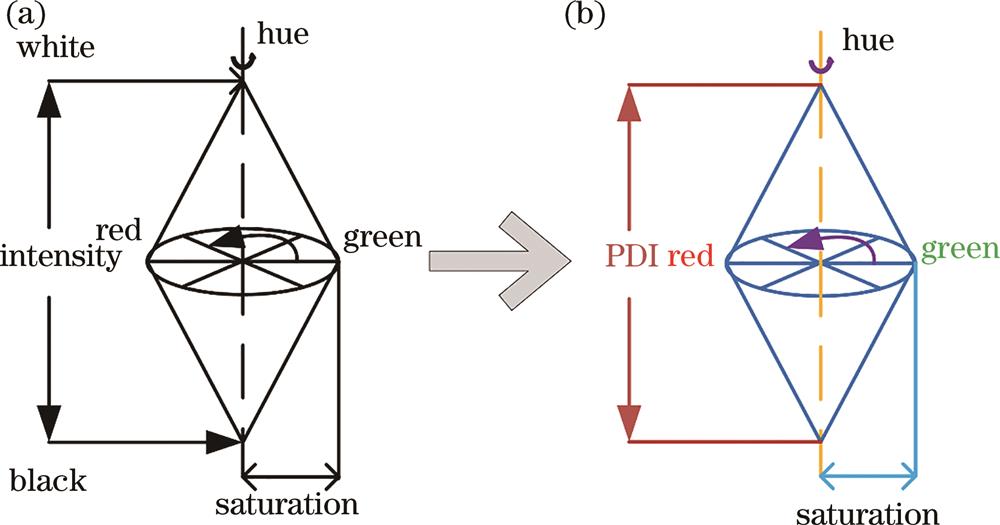
    Fig. 2. Mapping improvement program. (a) HSI model; (b) PDI model
    Original image and experimental image of threshold range ∆. (a) Original image; (b) experimental image of threshold range ∆
    Fig. 3. Original image and experimental image of threshold range . (a) Original image; (b) experimental image of threshold range
    Polarization imaging device
    Fig. 4. Polarization imaging device
    Statistical chart of mean range
    Fig. 5. Statistical chart of mean range
    Gray scale contrast value of the different threshold nodes
    Fig. 6. Gray scale contrast value of the different threshold nodes
    Signal-to-clutter ratio value of different threshold nodes
    Fig. 7. Signal-to-clutter ratio value of different threshold nodes
    Fisher distance value of different threshold nodes
    Fig. 8. Fisher distance value of different threshold nodes
    Graphs of experimental results for four experimental scenarios. (a)-(d) Original light intensity graphs; (e)-(h) experimental graphs of the angle of polarization; (i)-(l) experimental graphs of Lin's scheme[4]; (m)-(p) experimental graphs of Tyo's scheme[5]; (q)-(t) experimental graphs of Zhong's scheme[23]; (u)-(x) experimental graphs of the PDI model in this paper
    Fig. 9. Graphs of experimental results for four experimental scenarios. (a)-(d) Original light intensity graphs; (e)-(h) experimental graphs of the angle of polarization; (i)-(l) experimental graphs of Lin's scheme[4]; (m)-(p) experimental graphs of Tyo's scheme[5]; (q)-(t) experimental graphs of Zhong's scheme[23]; (u)-(x) experimental graphs of the PDI model in this paper
    Serial numberTargetIAOPLinTyoZhongPDI
    Experiment oneAircraft0.08680.04590.09920.02060.22230.1139
    Experiment twoManhole cover0.11150.02870.13760.05090.24740.2899
    Experiment threeSpider0.00280.00620.19120.00660.15690.0958
    Experiment fourTransparent ball0.23390.10770.19230.09550.07590.2594
    Table 1. Gray scale contrast value in multiple scenes
    Serial numberTargetIAOPLinTyoZhongPDI
    Experiment oneAircraft0.44540.12610.29310.10190.66831.0503
    Experiment twoManhole cover0.51170.11150.48690.08980.67491.3773
    Experiment threeSpider0.01060.02420.43310.04380.37210.4789
    Experiment fourTransparent ball0.83500.54510.33760.71020.18592.5167
    Table 2. Signal-to-clutter ratio value in multiple scenes
    Serial numberTargetIAOPLinTyoZhongPDI
    Experiment oneAircraft0.03860.00820.02880.02150.12470.3551
    Experiment twoManhole cover0.10250.00770.09190.00470.20672.6003
    Experiment threeSpider0.00040.00030.06260.00080.05570.0752
    Experiment fourTransparent ball0.20690.11650.07660.19590.01902.1592
    Table 3. Fisher distance value in multiple scenes
    Zhiqiang Zhou, Xin Wang, Tian Yang, Hao Cui, Jun Gao. Algorithm of Target Enhancement Under Shadow that Combining Polarization Distance and Color Space[J]. Laser & Optoelectronics Progress, 2023, 60(12): 1210024
    Download Citation