
Yifan Shi, Ning Li, Xiaolong Huang, Yang Kang, Can Li, Chunsheng Weng. Non-Dispersive Multi-Wavelength Modulation Absorption Spectrum Measurement Method[J]. Laser & Optoelectronics Progress, 2023, 60(1): 0107001
- Laser & Optoelectronics Progress
- Vol. 60, Issue 1, 0107001 (2023)

Fig. 1. Correspondence between line strength/line strength ratio and temperature (7185.60 cm-1/7444.35 cm-1). (a) Line strength; (b) line strength ratio
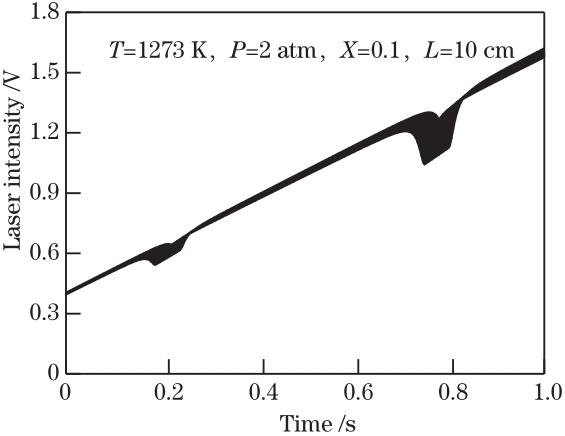
Fig. 2. Laser transmission signal simulation result
Fig. 3. Second harmonic signal after demodulation of multiplexed transmission signals of 7185.60 cm-1/7444.35 cm-1
Fig. 4. Influence of modulation coefficient m on simulation results. (a) Second harmonic signal; (b) temperature relative error
Fig. 5. Influence of relative position of spectral line on simulation result
Fig. 6. Different modulation frequency signal superposition results. (a) Time domain diagram; (b) frequency domain diagram
Fig. 7. Demodulation results of two spectral lines with same modulation frequency and different modulation frequencies. (a) Modulation frequencies both 1 kHz; (b) line 7185.60 cm-1 with modulation frequency of 800 Hz; (c) line 7444.35 cm-1 with modulation frequency of 1 kHz
Fig. 8. Speed and pressure graphs obtained by CE/SE method simulation. (a) Speed graph; (b) pressure graph
Fig. 9. Schematic diagram of measurement system
Fig. 10. Second harmonic demodulation results at typical moments. (a) Modulation frequencies both 500 kHz demodulation result; (b) line 7444.35 cm-1 with modulation frequency 500 kHz demodulation result at 2.2 ms; (c) line 7185.60 cm-1 with modulation frequency 400 kHz demodulation result at 2.2 ms
|
Table 1. Comparison of temperatures obtained through simulation and calculated temperatures at different time


Set citation alerts for the article
Please enter your email address

© Copyright 2018-2021 | Chinese Laser Press. All Rights Reserved 沪ICP备15018463号-20