
Hairui Zeng, Huayan Sun, Lin Du, Shuai Wang. High Dynamic Range Image Synthesis for Space Target Observation[J]. Laser & Optoelectronics Progress, 2019, 56(4): 041002
- Laser & Optoelectronics Progress
- Vol. 56, Issue 4, 041002 (2019)
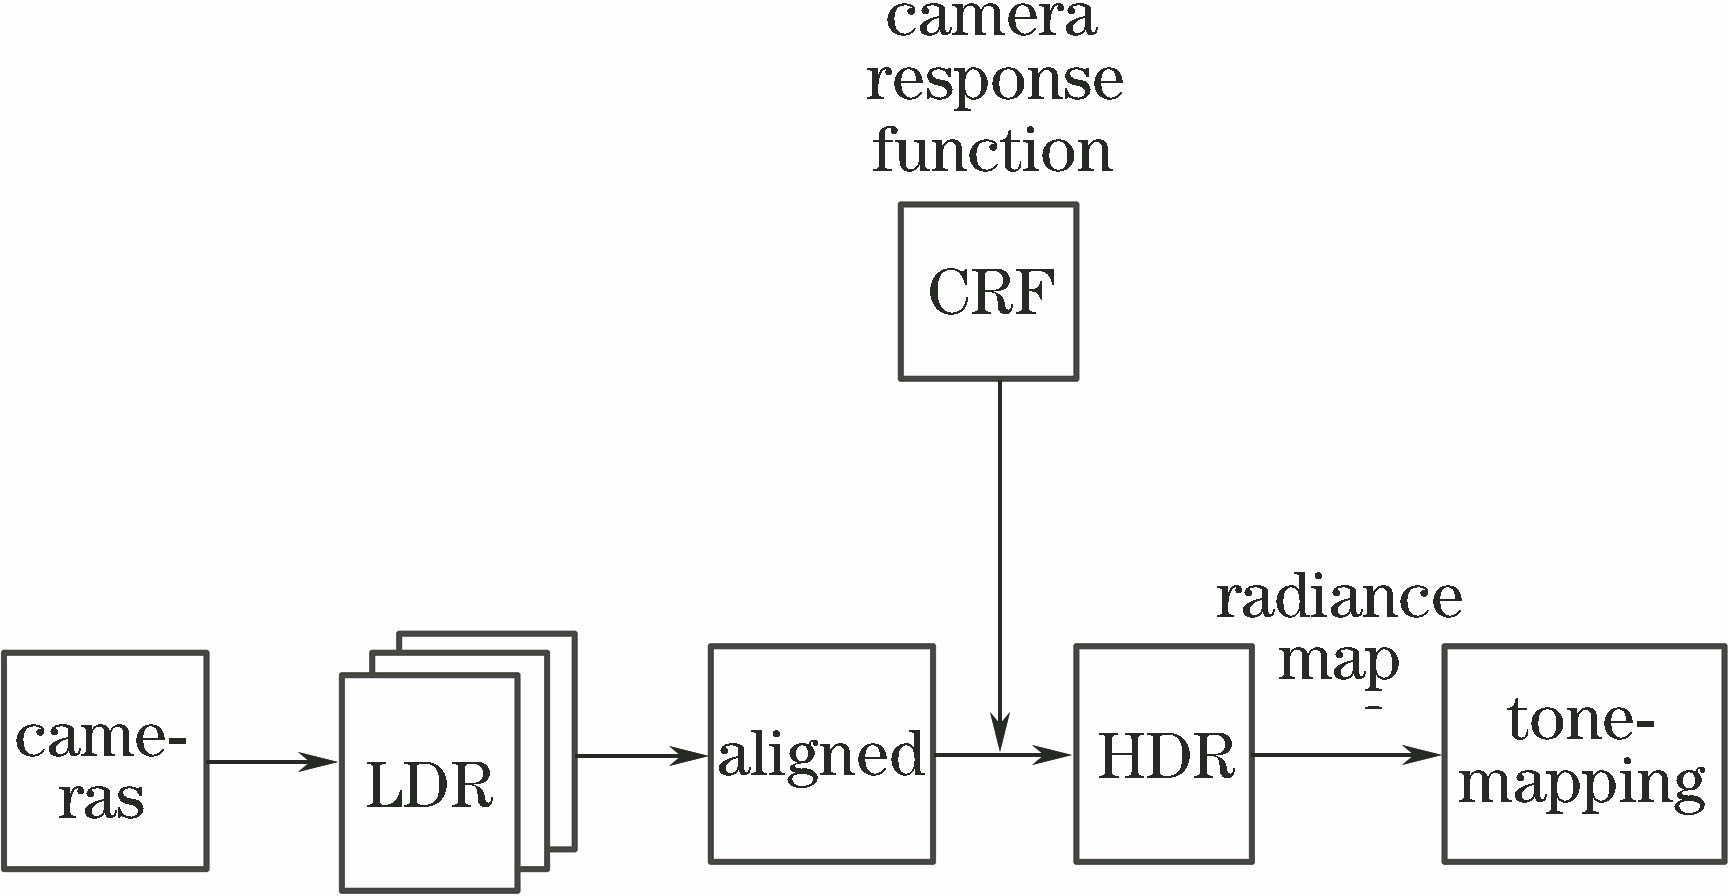
Fig. 1. Flow chart of high dynamic range image synthesis
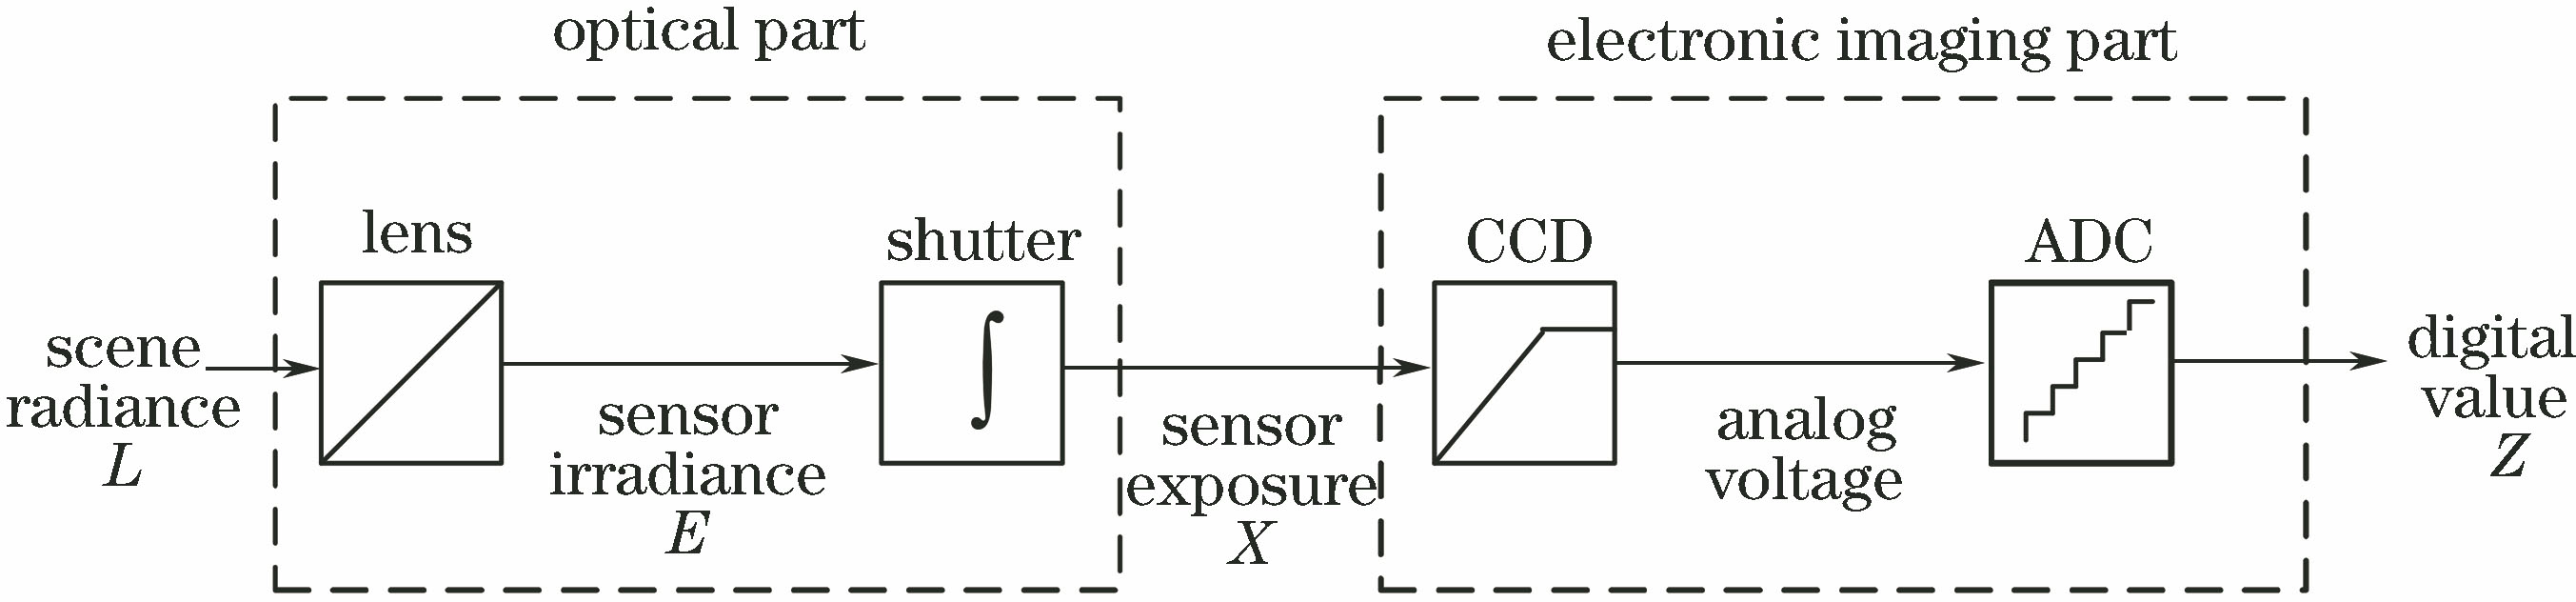
Fig. 2. Flow chart of digital image imaging
Fig. 3. Inverse camera response function curves of Canon EOS-1DC
Fig. 4. Image registration results. (a) Image to be registered; (b) reference image; (c) image after registration
Fig. 5. Experimental platform. (a) Cameras; (b) lenses
Fig. 6. First set of images captured by different cameras at different exposure time. (a) 0.1 s; (b) 0.5 s; (c) 1.0 s; (d) 2.0 s
Fig. 7. First combination results obtained by different methods. (a) Proposed method; (b) method in Ref.[18]
Fig. 8. Second set of images captured by different cameras at different exposure time.(a) 0.05 s; (b) 0.2 s; (c) 0.8 s; (d) 3.2 s
Fig. 9. Second combination results obtained by different methods. (a) Proposed method; (b) method in Ref.[18]
Fig. 10. Target grayscale distributions in different directions. (a) x-axis; (b) y-axis
| ||||||||||||||||||||||||||||||||||
Table 1. Comparison of data before and after synthesis of first set of images
| ||||||||||||||||||||||||||||||||||
Table 2. Comparison of data before and after synthesis of the second set of images


Set citation alerts for the article
Please enter your email address

© Copyright 2018-2021 | Chinese Laser Press. All Rights Reserved 沪ICP备15018463号-20