• Journal of Applied Optics
  • Vol. 44, Issue 1, 113 (2023)
Chenxi DUAN1, Zhonghui SUN2, Haiqing LI2, Jinping NI1,*, and Zhichao WU1
Author Affiliations
  • 1Shaanxi Province Key Laboratory of Photoelectric Measurement and Instrument Technology, School of Optoelectronic Engineering, Xi'an Technological University, Xi'an 710021, China
  • 2No.63853 Unit of PLA, Baicheng 137001, China
  • show less
    DOI: 10.5768/JAO202344.0103001 Cite this Article
    Chenxi DUAN, Zhonghui SUN, Haiqing LI, Jinping NI, Zhichao WU. Sensitivity distribution of large-area triangular detection light screen with original reflection[J]. Journal of Applied Optics, 2023, 44(1): 113 Copy Citation Text show less
    Structure diagram of large-area triangular detection light screen with original reflection
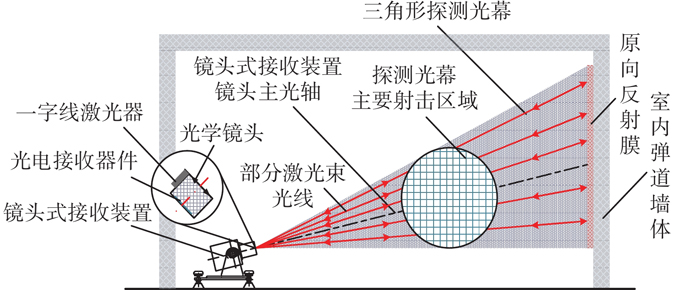
    Fig. 1. Structure diagram of large-area triangular detection light screen with original reflection
    Schematic diagram of light intensity propagation of detection light screen
    Fig. 2. Schematic diagram of light intensity propagation of detection light screen
    Change curves of four impact factors
    Fig. 3. Change curves of four impact factors
    Change curve of light intensity Iˊ0 projected onto reflective film converging at lens
    Fig. 4. Change curve of light intensity Iˊ0 projected onto reflective film converging at lens
    Schematic diagram of selection of feature line segment for detection light screen
    Fig. 5. Schematic diagram of selection of feature line segment for detection light screen
    Sensitivity change curve on feature line segments
    Fig. 6. Sensitivity change curve on feature line segments
    Sensitivity δ´ airspace distribution of detection light screen
    Fig. 7. Sensitivity δ´ airspace distribution of detection light screen
    Sensitivity δ´ distribution in main firing area
    Fig. 8. Sensitivity δ´ distribution in main firing area
    Normalized numerical curve on AAʹ
    Fig. 9. Normalized numerical curve on AAʹ
    Normalized numerical curve onBBʹ
    Fig. 10. Normalized numerical curve onBBʹ
    Schematic diagram of firing test point in main firing area
    Fig. 11. Schematic diagram of firing test point in main firing area
    Test results in main firing area
    Fig. 12. Test results in main firing area
    竖直高度/m水平距离/m
    0.601.201.752.302.90
      注:--为非特征线段上测试点。
    0.05----3.00----
    0.19----1.72----
    0.335.041.561.481.441.4
    0.56----1.32----
    0.74----1.04----
    Table 1. Analog signal voltage amplitude data results on feature line segments V
    竖直高度/m水平距离/m
    1.471.611.751.892.03
      注:--为主要射击区域外测试点。
    0.01----3.00----
    0.19--2.161.721.64--
    0.331.561.481.481.441.4
    0.56--1.361.320.84--
    0.74----1.04----
    Table 2. Analog signal voltage amplitude data in main firing area V
    Chenxi DUAN, Zhonghui SUN, Haiqing LI, Jinping NI, Zhichao WU. Sensitivity distribution of large-area triangular detection light screen with original reflection[J]. Journal of Applied Optics, 2023, 44(1): 113
    Download Citation