• Laser & Optoelectronics Progress
  • Vol. 60, Issue 17, 1730002 (2023)
Jie Wang1, Rui Liu1, Wenlong Liao1, Xinyi Ren2,*..., Hui Ma2, Ming Yan2, Heping Zeng2, Qinqing Huang3 and Lin Cheng3|Show fewer author(s)
Author Affiliations
  • 1Power Science Research Institute of State Grid, Sichuan Electric Power Company, Chengdu 610041, Sichuan , China
  • 2Chongqing Institute of East China Normal University, Chongqing 401121, China
  • 3Wuhan NARI Co., Ltd., State Grid Electric Power Research Institute, Wuhan 430074, Hubei , China
  • show less
    DOI: 10.3788/LOP222318 Cite this Article Set citation alerts
    Jie Wang, Rui Liu, Wenlong Liao, Xinyi Ren, Hui Ma, Ming Yan, Heping Zeng, Qinqing Huang, Lin Cheng. Study on Electro-Optic Dual-Comb Spectroscopy for Gas Concentration Measurement[J]. Laser & Optoelectronics Progress, 2023, 60(17): 1730002 Copy Citation Text show less
    Schematic diagram of multiheterodyne detection in frequency domain of EODCS
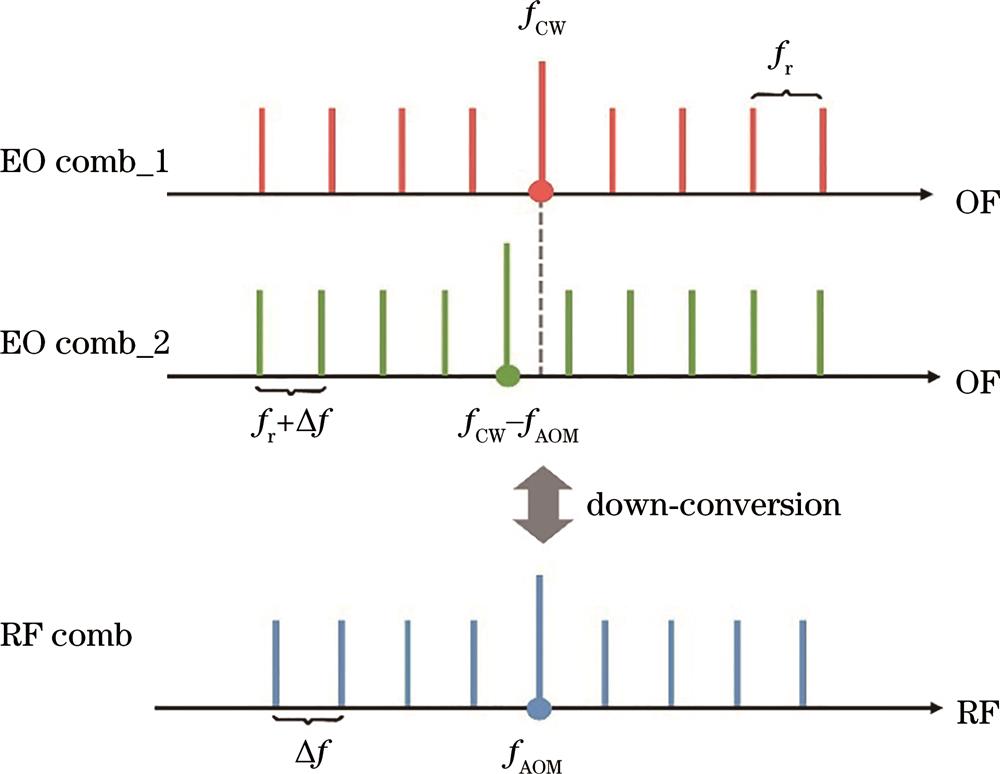
    Fig. 1. Schematic diagram of multiheterodyne detection in frequency domain of EODCS
    Diagram of EODCS experimental setup
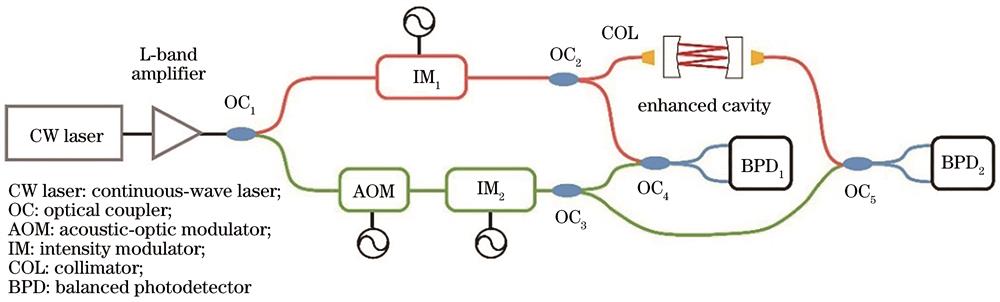
    Fig. 2. Diagram of EODCS experimental setup
    Time and frequency domain characteristics of dual-comb system. (a) Heterodyne interferograms in the time domain; (b) Fourier-transformed radio frequency spectrum
    Fig. 3. Time and frequency domain characteristics of dual-comb system. (a) Heterodyne interferograms in the time domain; (b) Fourier-transformed radio frequency spectrum
    Signal-to-noise ratio as a function of acquisition duration
    Fig. 4. Signal-to-noise ratio as a function of acquisition duration
    Comparision between normalized dual-comb spectra and the HITRAN simulation data of different gases. (a) CO2 during 6361.91~6365.35 cm-1; (b) CO at 6338.59 cm-1
    Fig. 5. Comparision between normalized dual-comb spectra and the HITRAN simulation data of different gases. (a) CO2 during 6361.91~6365.35 cm-1; (b) CO at 6338.59 cm-1
    Concentration measurement of CO2 different absorption peaks
    Fig. 6. Concentration measurement of CO2 different absorption peaks
    Evolution of CO concentration
    Fig. 7. Evolution of CO concentration
    Absorption peak /cm-1L /cmS /(10-23 cm-1·mol-1·cm2Ttemp /KAabs /cm-1N /(1018 mol·cm-3C
    6327.0610001.29296.150.10067.810.4913
    6330.8210001.52296.150.11507.560.4751
    6334.4610001.62296.150.12487.690.4835
    6337.9910001.53296.150.11837.750.4876
    6341.3910001.20296.150.09397.820.4919
    6355.9410001.55296.150.11427.360.4628
    6362.5010001.64296.150.12917.870.4949
    6363.7210001.52296.150.12368.110.5102
    6364.9210001.38296.150.10427.530.4737
    Table 1. Measured concentration of CO2
    Jie Wang, Rui Liu, Wenlong Liao, Xinyi Ren, Hui Ma, Ming Yan, Heping Zeng, Qinqing Huang, Lin Cheng. Study on Electro-Optic Dual-Comb Spectroscopy for Gas Concentration Measurement[J]. Laser & Optoelectronics Progress, 2023, 60(17): 1730002
    Download Citation