Author Affiliations
1Institute of Space Science and Technology, Nanchang University, Nanchang 330031, Jiangxi, China2School of Information Engineering, Nanchang University, Nanchang 330031, Jiangxi, Chinashow less
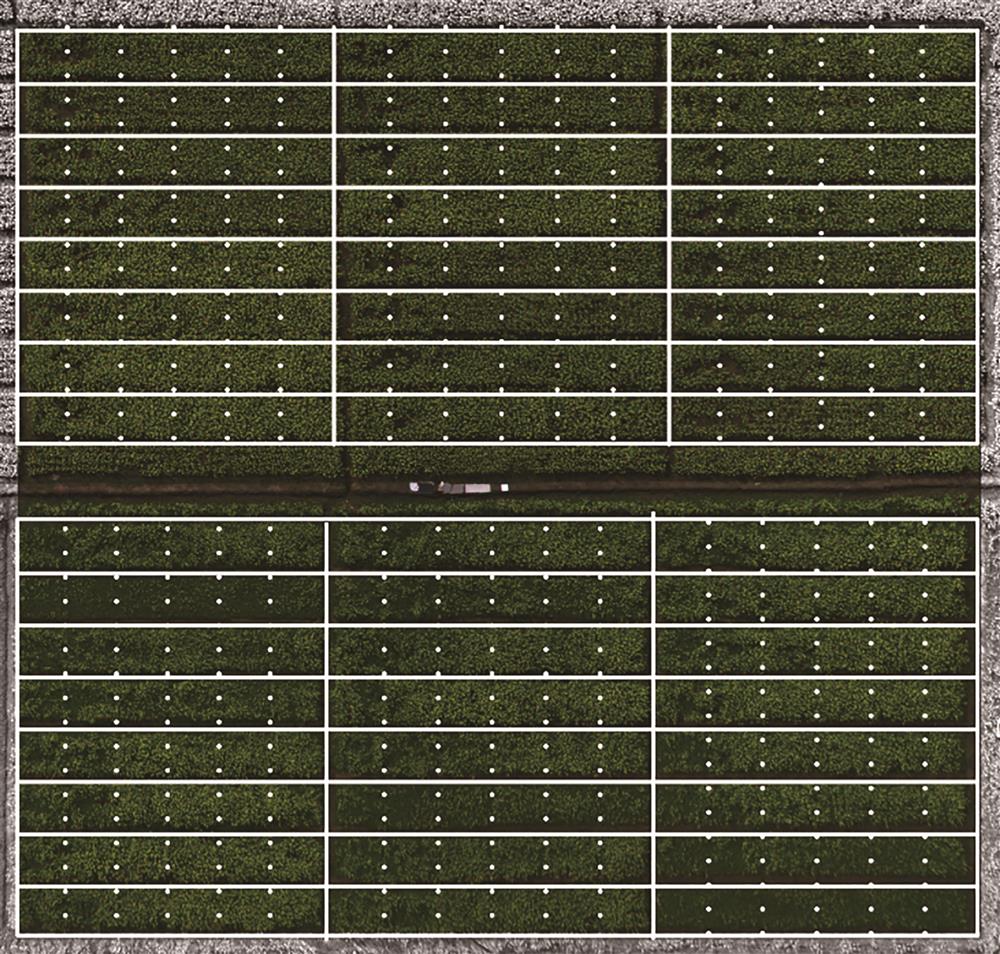
Fig. 1. Ground test plot
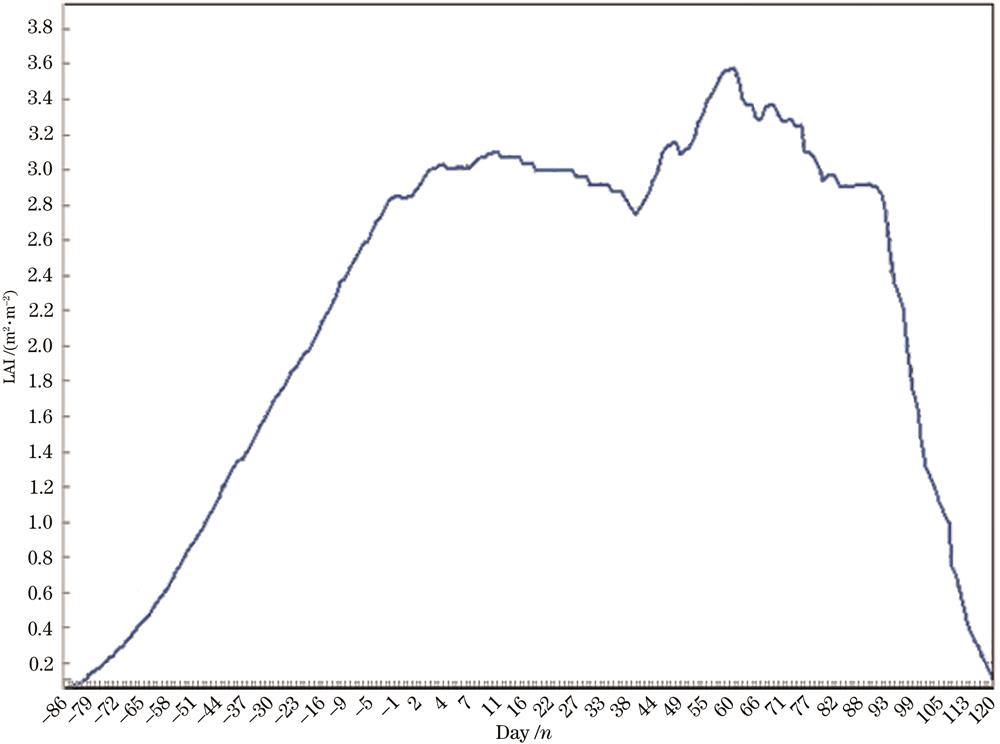
Fig. 2. LAI assimilation results of Jingzhou city in 2015
Fig. 3. Classification results of GF-1 WFV image in Yangxin county in 2019.(a) GF-1 WFV image of Yangxin county in April 2019; (b) classification results of GF-1 WFV images based on pyramidal bottleneck residual network
Fig. 4. Comparison of rape extraction results and statistical yearbook
Fig. 5. Comparison of rapeseed yield estimation results and statistical yearbook
| Study area | Weather station location |
|---|
| Zhongxiang | N31°6′00″,E112°20′24″ | | Macheng | N31°6′36″,E115°0′36″ | | Jianli | N29°30′00″,E112°32′24″ | | Jiayu | N29°35′24″,E113°33′00″ | | Jingzhou | N30°12′36″,E112°5′23″ | | Yangxin | N29°30′36″,E115°7′11″ |
|
Table 1. Study area and weather station locations
| Coverage area | Number of images |
|---|
| Jingzhou | 4 | | Macheng | 2 | | Zhongxiang | 2 | | Wuxue | 2 | | Jiayu | 4 |
|
Table 2. GF-1 WFV image information for model construction
| Get time | Growth period |
|---|
| 2015-01-22 | bolting stage | | 2015-03-12 | flowering stage | | 2016-02-03 | bolting stage | | 2016-03-19 | flowering stage | | 2018-02-06 | bolting stage | | 2018-03-28 | flowering stage | | 2019-01-17 | bolting stage | | 2019-04-01 | flowering stage | | 2020-01-29 | bolting stage | | 2020-03-18 | flowering stage |
|
Table 3. GF-1 WFV image information of Yangxin County for model validation
| Year | Day | Minimum temperature /℃ | Maximum temperature /℃ | Average air pressure /Pa | Sunshine time /h | Rainfall /mm | Average wind speed /(m·s-1) |
|---|
| 2017 | 1 | 5.2 | 9.8 | 10152 | 1.9 | 0 | 15 | | 2017 | 2 | 6.7 | 8.6 | 10158 | 2.5 | 3.7 | 14 | | 2017 | 3 | 3.3 | 6.7 | 10202 | 3.2 | 13.5 | 13 | | 2017 | 4 | -0.3 | 3.3 | 10187 | 3.6 | 35.1 | 16 | | 2017 | 5 | -1.2 | 1.3 | 10192 | 2.3 | 0 | 29 | | 2017 | 6 | 1.1 | 2.5 | 10140 | 3.2 | 4.4 | 24 | | 2017 | 7 | -0.7 | 1.7 | 10152 | 2.8 | 1.3 | 24 | | 2017 | 8 | -0.5 | 7 | 10210 | 3.4 | 0.1 | 22 | | 2017 | 9 | -2 | 10.1 | 10217 | 4.2 | 0 | 22 | | 2017 | 10 | -1.3 | 10.7 | 10237 | 2.2 | 0 | 27 | | 2017 | 11 | -1.2 | 10.8 | 10253 | 2.8 | 0 | 20 | | 2017 | 12 | -2 | 9.2 | 10257 | 3 | 0 | 16 | | 2017 | 13 | 0.5 | 8.8 | 10212 | 2.6 | 0 | 23 | | 2017 | 14 | 2 | 13.8 | 10165 | 2 | 0 | 28 | | 2017 | 15 | 3.4 | 10.4 | 10126 | 1.5 | 0 | 23 | | 2017 | 16 | 5.8 | 9 | 10115 | 1.7 | 2.2 | 25 | | 2017 | 17 | 4.9 | 12 | 10115 | 2.1 | 0 | 9 | | 2017 | 18 | 4 | 9 | 10152 | 2.6 | 0 | 17 | | 2017 | 19 | 4.8 | 7 | 10175 | 1.8 | 2.8 | 20 | | 2017 | 20 | 5.2 | 7.7 | 10148 | 0.7 | 3.8 | 25 | | 2017 | 21 | 6.1 | 7.4 | 10130 | 2.1 | 12.1 | 15 | | 2017 | 22 | 3.7 | 12.5 | 10122 | 2.8 | 0 | 27 | | 2017 | 23 | 3.9 | 8.5 | 10139 | 4 | 0 | 26 | | 2017 | 24 | 2.2 | 4 | 10146 | 4.3 | 7.4 | 27 | | 2017 | 25 | -1.8 | 2.2 | 10177 | 4.8 | 14 | 17 | | 2017 | 26 | -2.5 | -0.9 | 10232 | 3.7 | 3.4 | 23 | | 2017 | 27 | -2.8 | -0.8 | 10185 | 3.6 | 11.5 | 18 | | 2017 | 28 | -3.8 | -1.3 | 10225 | 2.9 | 0.8 | 23 | | 2017 | 29 | -5.6 | 1.2 | 10248 | 1.6 | 0 | 32 | | 2017 | 30 | -5.4 | 2.8 | 10215 | 2.2 | 0 | 28 |
|
Table 4. Data information of weather station in Jiayu county in the first 30 days of 2017
| Index | Seedling stage | Bolting stage | Flowering stage | Pod stage | Bolting stage+flowering stage |
|---|
| R2 | 0.21 | 0.70 | 0.59 | 0.84 | 0.72 | | SE /(kg·hm-2) | 764 | 475 | 561 | 352 | 424 |
|
Table 5. Coefficient of determination R2 and standard error (SE) of estimated yield of rapeseed LAI in the four growing periods
| Vegetation index | Formula |
|---|
| NDVI | | | VARIgreen | | | MSAVI | | | EVI2 | | | SR | |
|
Table 6. Vegetation index used in study
| Inversion model | Vegetation index | Decisive factor R2 | Period |
|---|
| NDVI | | 0.7498 | bolting stage | | VARIgreen | | 0.6917 | bolting stage | | MSAVI | | 0.746 | bolting stage | | EVI | | 0.7602 | bolting stage | | SR | | 0.8209 | bolting stage | | NDVI | | 0.1384 | flowering stage | | VARIgreen | | 0.7708 | flowering stage | | MSAVI | | 0.154 | flowering stage | | EVI | | 0.1282 | flowering stage | | SR | | 0.1508 | flowering stage |
|
Table 7. Vegetation index and LAI
| Year | Illustrated data /km2 | Classification data /km2 | Illustrated output /t | Forecast output /t | Error rate total output /% |
|---|
| 2015 | 16.82 | 17.36 | 32393 | 34142.53 | 5.4 | | 2016 | 16.44 | 15.67 | 33372 | 31420.02 | -5.8 | | 2018 | 15 | 15.48 | 35397 | 36037.11 | 1.7 | | 2019 | 17.66 | 18.16 | 37086 | 36064.74 | 2.7 | | 2020 | 18.3 | 17.67 | 39622 | 41210.17 | 4.0 |
|
Table 8. Comparison of rapeseed yield estimated results and statistical yearbook