• Laser & Optoelectronics Progress
  • Vol. 56, Issue 10, 101003 (2019)
Dongyu Xu1, Xiaorun Li1,*, Liaoying Zhao2, Rui Shu3, and Qijia Tang3
Author Affiliations
  • 1 School of Electrical Engineering, Zhejiang University, Hangzhou, Zhejiang 310027, China
  • 2 Institute of Computer Application Technology, Hangzhou Dianzi University, Hangzhou, Zhejiang 310018, China
  • 3 Shanghai Institute of Satellite Engineering, Shanghai 200240, China
  • show less
    DOI: 10.3788/LOP56.101003 Cite this Article Set citation alerts
    Dongyu Xu, Xiaorun Li, Liaoying Zhao, Rui Shu, Qijia Tang. Hyperspectral Remote Sensing Image Cloud Detection Based on Spectral Analysis and Dynamic Fractal Dimension[J]. Laser & Optoelectronics Progress, 2019, 56(10): 101003 Copy Citation Text show less
    Remote sensing image with thick clouds, thin clouds, snow, sea, and land and their spectral curves. (a) Remote sensing image; (b) spectral curves
    Fig. 1. Remote sensing image with thick clouds, thin clouds, snow, sea, and land and their spectral curves. (a) Remote sensing image; (b) spectral curves
    Flow chart of cloud detection algorithm based on dynamic fractal dimension and radiation characteristics
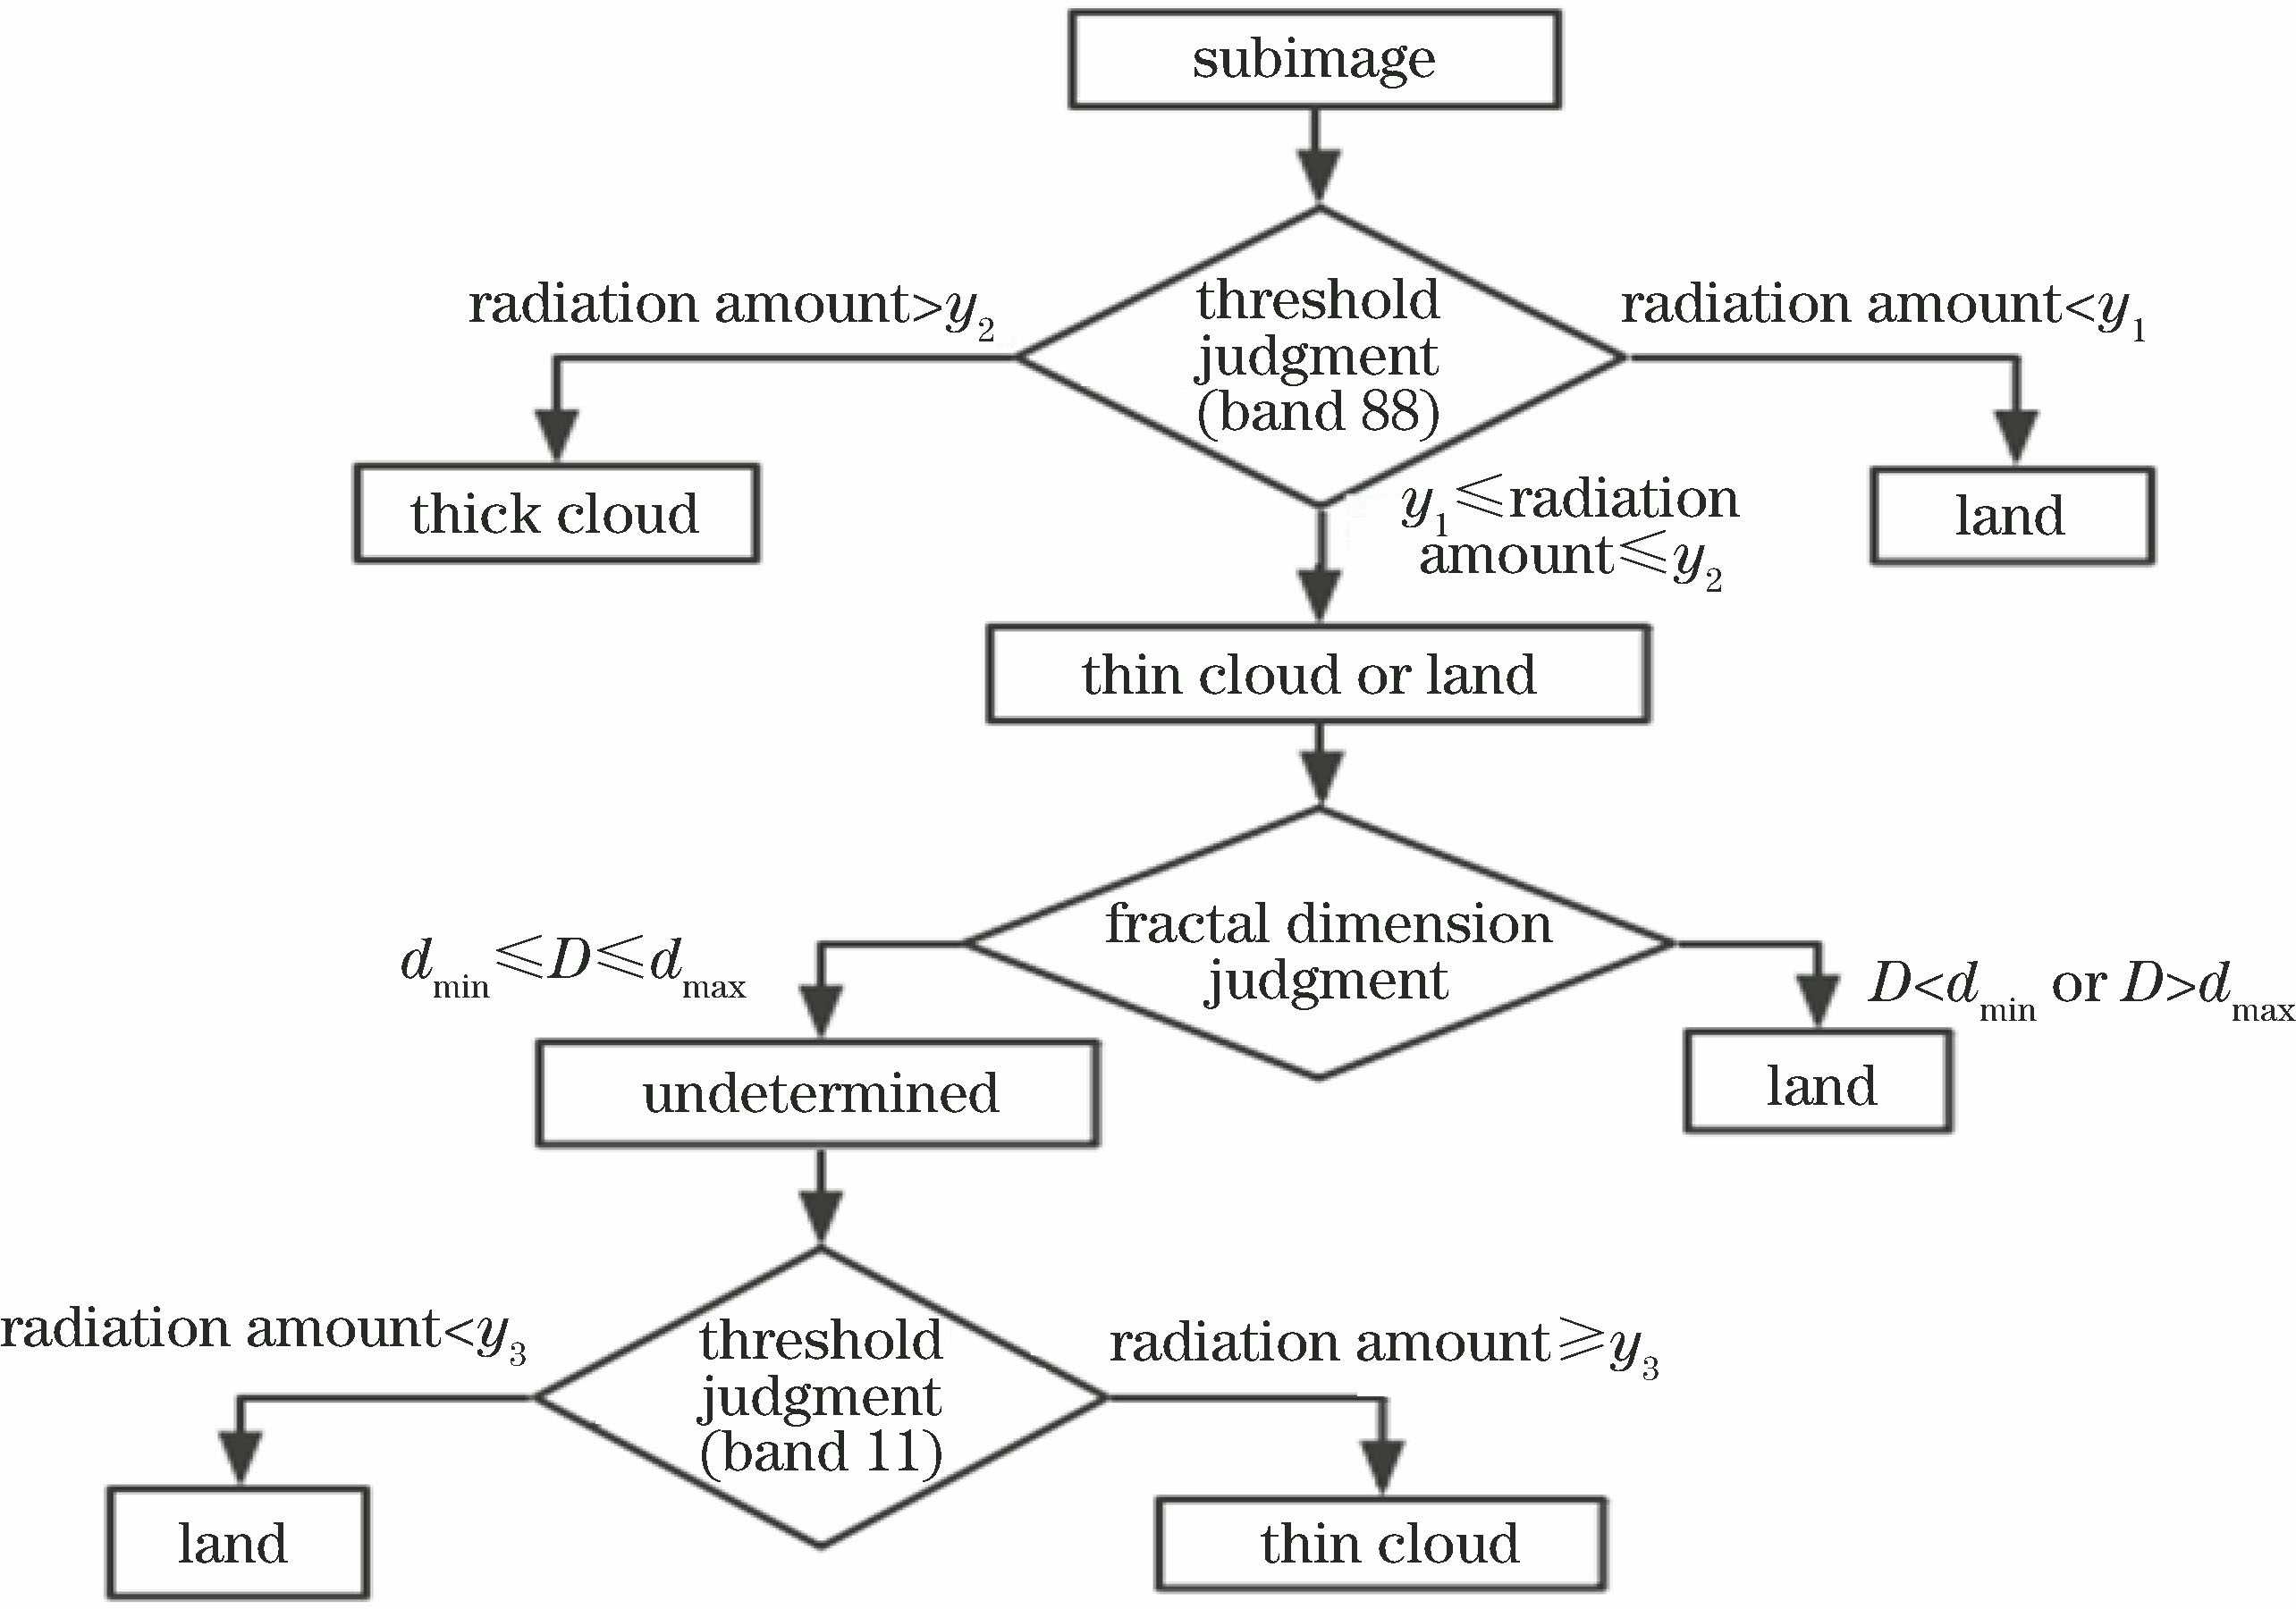
    Fig. 2. Flow chart of cloud detection algorithm based on dynamic fractal dimension and radiation characteristics
    Sample images of remote sensing cloud detection. (a) Sample A; (b) sample B; (c) sample C; (d) sample D; (e) sample E; (f) sample F; (g) sample G; (h) sample H
    Fig. 3. Sample images of remote sensing cloud detection. (a) Sample A; (b) sample B; (c) sample C; (d) sample D; (e) sample E; (f) sample F; (g) sample G; (h) sample H
    True value cloud maps. (a) Sample A; (b) sample B; (c) sample C; (d) sample D; (e) sample E; (f) sample F; (g) sample G; (h) sample H
    Fig. 4. True value cloud maps. (a) Sample A; (b) sample B; (c) sample C; (d) sample D; (e) sample E; (f) sample F; (g) sample G; (h) sample H
    Detection results of MRC algorithm. (a) Sample A; (b) sample B; (c) sample C; (d) sample D; (e) sample E; (f) sample F; (g) sample G; (h) sample H
    Fig. 5. Detection results of MRC algorithm. (a) Sample A; (b) sample B; (c) sample C; (d) sample D; (e) sample E; (f) sample F; (g) sample G; (h) sample H
    Detection results of DFD_RC algorithm. (a) Sample A; (b) sample B; (c) sample C; (d) sample D; (e) sample E; (f) sample F; (g) sample G; (h) sample H
    Fig. 6. Detection results of DFD_RC algorithm. (a) Sample A; (b) sample B; (c) sample C; (d) sample D; (e) sample E; (f) sample F; (g) sample G; (h) sample H
    Partially enlarged images of MRC algorithm. (a) Sample B; (b) sample H; (c) sample G; (d) sample C
    Fig. 7. Partially enlarged images of MRC algorithm. (a) Sample B; (b) sample H; (c) sample G; (d) sample C
    Partially enlarged images of DFD_RC algorithm. (a) Sample B; (b) sample H; (c) sample G; (d) sample C
    Fig. 8. Partially enlarged images of DFD_RC algorithm. (a) Sample B; (b) sample H; (c) sample G; (d) sample C
    Sample numberImaging timeLocationType of landType of cloud
    Sample A2017-02-03Hong KongSeaThick cloud (small quantity)
    Sample B2016-09-06Japan IslandSeaThick cloud (medium quantity)
    Sample C2017-04-23Caribbean SeaSeaThick cloud (large quantity)
    Sample D2017-02-03Hong KongSea, LandThin cloud (small quantity)
    Sample E2017-01-17NorwaySea, Land, SnowThick and thin cloud (small quantity)
    Sample F2017-04-23Caribbean SeaSea, landThick and thin cloud (small quantity)
    Sample G2017-11-30New YorkLandThin cloud (large quantity)
    Sample H2017-11-30New YorkLandThick cloud (small quantity)
    Table 1. Information of remote sensing cloud detection sample images
    ParameterSample ASample BSample CSample DSample ESample FSample GSample H
    Cloud ratio11.641530.907469.354037.014513.469610.003143.57387.0778
    Thick cloud ratio7.849122.672750.52777.36757.22627.15814.75505.9434
    Thin cloud ratio3.79248.234718.826429.64716.24342.844938.81881.1343
    Table 2. Cloud content ratios of true value cloud maps %
    ParameterSample ASample BSample CSample DSample ESample FSample GSample H
    Cloud ratio byMRC12.237424.150828.42411.860920.84527.37862.68320.6023
    Thick cloud ratioby MRC5.817210.47331.05460.37629.35896.16932.68320.6023
    Thin cloud ratioby MRC6.420213.677527.36951.484711.48631.209300
    Cloud ratio byDFD_RC11.585128.261564.707113.074113.00269.769038.43356.7717
    Thick cloud ratioby DFD_RC7.930819.540252.06997.89127.56319.03747.99976.1051
    Thin cloud ratioby DFD_RC3.65428.721312.63725.18295.43950.731630.43380.6667
    Table 3. Detection results of cloud content%
    ParameterSample ASample BSample CSample DSample ESample FSample GSample H
    Recall rate by MRC /%95.590.354.78.586.488.18.710.5
    Leak alarm by MRC /%4.59.745.391.513.611.991.389.5
    Accuracy rate by MRC /%97.296.599.697.892.496.399.198.7
    False alarm by MRC /%2.83.50.42.27.63.70.91.3
    Recall rate by DFD_RC /%97.797.298.674.393.895.590.091.1
    Leak alarm by DFD_RC /%2.32.81.425.76.24.510.08.9
    Accuracy rate by DFD_RC /%98.896.399.698.787.396.196.796.5
    False alarm by DFD_RC /%1.23.70.41.312.73.93.33.5
    Mean time by MRC /s0.3807
    Mean time by DFD_RC /s0.7900
    Table 4. Classification indexes
    Dongyu Xu, Xiaorun Li, Liaoying Zhao, Rui Shu, Qijia Tang. Hyperspectral Remote Sensing Image Cloud Detection Based on Spectral Analysis and Dynamic Fractal Dimension[J]. Laser & Optoelectronics Progress, 2019, 56(10): 101003
    Download Citation