• Laser & Optoelectronics Progress
  • Vol. 60, Issue 2, 0233002 (2023)
Jipeng Yang* and Jiulun Fan
Author Affiliations
  • School of Communication and Information Engineering, Xi'an University of Posts and Telecommunications, Xi'an 710121, Shaanxi, China
  • show less
    DOI: 10.3788/LOP212732 Cite this Article Set citation alerts
    Jipeng Yang, Jiulun Fan. Circular Histogram Breakpoint Selection and Threshold and Color Image Segmentation Method Based on Information Energy[J]. Laser & Optoelectronics Progress, 2023, 60(2): 0233002 Copy Citation Text show less
    Segmentation sample. (a) Color image; (b) circular histogram; (c) linearized histogram expanded in counterclockwise (ACW) direction at point t0
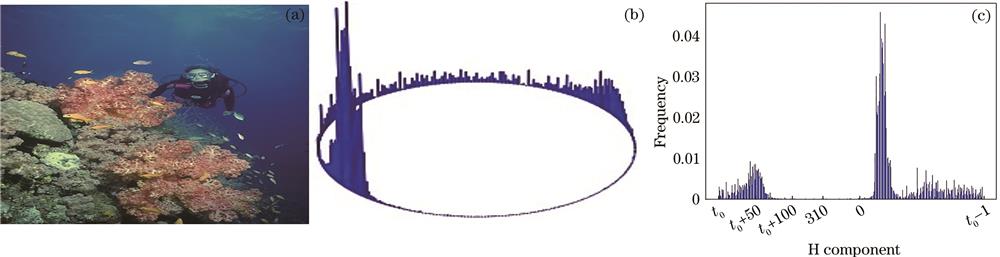
    Fig. 1. Segmentation sample. (a) Color image; (b) circular histogram; (c) linearized histogram expanded in counterclockwise (ACW) direction at point t0
    CDF of linear histogram expanded in ACW direction at different breakpoints. (a) t0=30; (b) t0=100; (c) t0=170; (d) t0=240
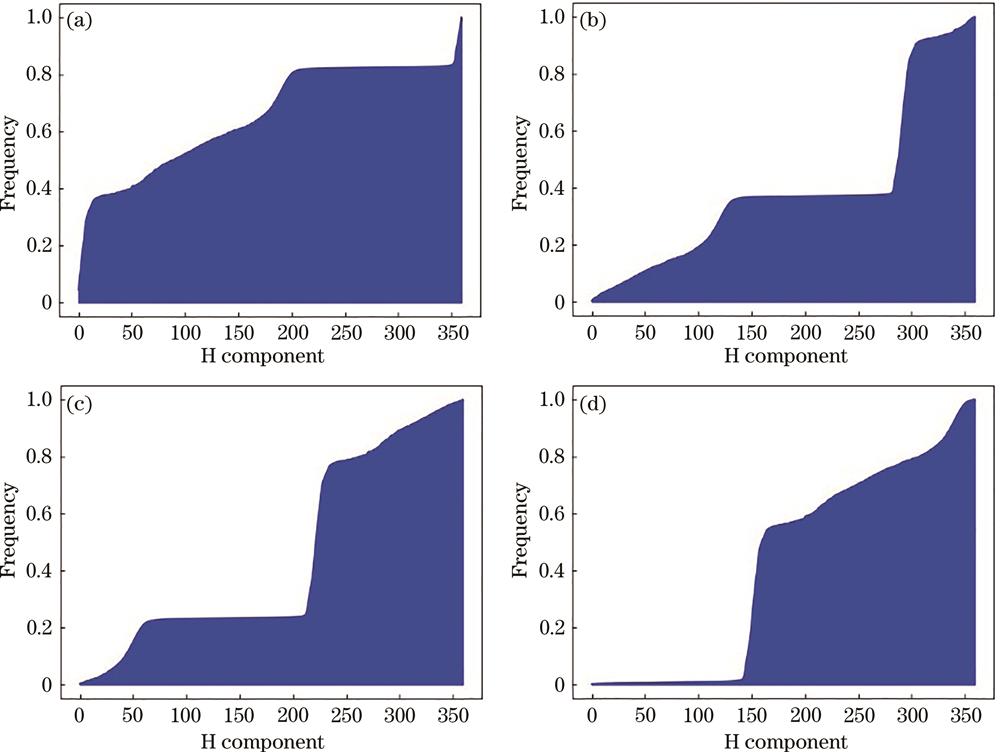
    Fig. 2. CDF of linear histogram expanded in ACW direction at different breakpoints. (a) t0=30; (b) t0=100; (c) t0=170; (d) t0=240
    CDF information energy curves of linear histogram. (a) CDF information energy curve (ACW); (b) linear histogram expanded at maximum information energy point t0=21; (c) linear histogram expanded at minimum information energy point t0=45
    Fig. 3. CDF information energy curves of linear histogram. (a) CDF information energy curve (ACW); (b) linear histogram expanded at maximum information energy point t0=21; (c) linear histogram expanded at minimum information energy point t0=45
    CDF information energy curves of linear histogram. (a) CDF information energy curve (ACW); (b) linear histogram expanded at maximum information energy point t0=47; (c) linear histogram expanded at minimum information energy point t0=21
    Fig. 4. CDF information energy curves of linear histogram. (a) CDF information energy curve (ACW); (b) linear histogram expanded at maximum information energy point t0=47; (c) linear histogram expanded at minimum information energy point t0=21
    Test images. (a) People; (b) flowers; (c) eagle; (d) roof; (e) car; (f) mountain; (g) boat; (h) building
    Fig. 5. Test images. (a) People; (b) flowers; (c) eagle; (d) roof; (e) car; (f) mountain; (g) boat; (h) building
    H component images. (a) People; (b) flowers; (c) eagle; (d) roof; (e) car; (f) mountain; (g) boat; (h) building
    Fig. 6. H component images. (a) People; (b) flowers; (c) eagle; (d) roof; (e) car; (f) mountain; (g) boat; (h) building
    Segmentation results of people. (a) Method 1; (b) method 2; (c) method 3; (d) method 4; (e) method 5; (f) method 6
    Fig. 7. Segmentation results of people. (a) Method 1; (b) method 2; (c) method 3; (d) method 4; (e) method 5; (f) method 6
    Segmentation results of flowers. (a) Method 1; (b) method 2; (c) method 3; (d) method 4; (e) method 5; (f) method 6
    Fig. 8. Segmentation results of flowers. (a) Method 1; (b) method 2; (c) method 3; (d) method 4; (e) method 5; (f) method 6
    Segmentation results of eagle. (a) Method 1; (b) method 2; (c) method 3; (d) method 4; (e) method 5; (f) method 6
    Fig. 9. Segmentation results of eagle. (a) Method 1; (b) method 2; (c) method 3; (d) method 4; (e) method 5; (f) method 6
    Segmentation results of roof. (a) Method 1; (b) method 2; (c) method 3; (d) method 4; (e) method 5; (f) method 6
    Fig. 10. Segmentation results of roof. (a) Method 1; (b) method 2; (c) method 3; (d) method 4; (e) method 5; (f) method 6
    Segmentation results of car. (a) Method 1; (b) method 2; (c) method 3; (d) method 4; (e) method 5; (f) method 6
    Fig. 11. Segmentation results of car. (a) Method 1; (b) method 2; (c) method 3; (d) method 4; (e) method 5; (f) method 6
    Segmentation results of mountain. (a) Method 1; (b) method 2; (c) mMethod 3; (d) method 4; (e) method 5; (f) method 6
    Fig. 12. Segmentation results of mountain. (a) Method 1; (b) method 2; (c) mMethod 3; (d) method 4; (e) method 5; (f) method 6
    Segmentation results of boat. (a) Method 1; (b) method 2; (c) method 3; (d) method 4; (e) method 5; (f) method 6
    Fig. 13. Segmentation results of boat. (a) Method 1; (b) method 2; (c) method 3; (d) method 4; (e) method 5; (f) method 6
    Segmentation results of building. (a) Method 1; (b) method 2; (c) method 3; (d) method 4; (e) method 5; (f) method 6
    Fig. 14. Segmentation results of building. (a) Method 1; (b) method 2; (c) method 3; (d) method 4; (e) method 5; (f) method 6
    Histogram of average PSNR, PA, and IoU of 6 methods
    Fig. 15. Histogram of average PSNR, PA, and IoU of 6 methods
    Histogram of average running time of 6 methods
    Fig. 16. Histogram of average running time of 6 methods
    Image numberMethod 1Method 2Method 3Method 4Method 5Method 6
    (a)0.91960.66650.92270.66650.50490.9310
    (b)0.83580.62950.83680.62950.83230.8755
    (c)0.94640.74180.95710.74180.93960.9719
    (d)0.70400.63430.74640.62710.85760.9068
    (e)0.79470.51330.82510.51340.10090.8475
    (f)0.59680.80620.59380.80620.55300.9199
    (g)0.51170.65800.53500.67340.51390.8250
    (h)0.74790.55040.76410.55040.49750.8673
    Mean0.75710.65000.77260.65100.60000.8931
    Table 1. Comparison of PA by 6 methods for 8 color images
    Image numberMethod 1Method 2Method 3Method 4Method 5Method 6
    (a)0.22510.12480.37510.12480.10430.3923
    (b)0.33950.24490.34620.24490.24030.5679
    (c)0.34580.09870.52990.09870.02680.7494
    (d)0.29710.31610.38870.29010.56160.6322
    (e)0.12430.09210.31650.09220.38350.3881
    (f)0.00000.62630.00040.62630.00620.8082
    (g)0.19590.24640.18360.03410.11490.3335
    (h)0.03960.19800.16930.19800.31290.4966
    Mean0.19590.24340.28870.21360.21880.5460
    Table 2. Comparison of IoU by 6 methods for 8 color images
    Image numberMethod 1Method 2Method 3Method 4Method 5Method 6
    (a)11.61684.957411.92284.95682.971612.6267
    (b)8.39334.59138.42024.59138.28219.9400
    (c)13.76466.000115.41046.000112.904318.8213
    (d)5.48584.54636.20264.45328.952811.0919
    (e)1.00493.25778.09053.25848.78838.7982
    (f)4.11197.62734.07807.62733.644912.3071
    (g)2.91414.87642.72111.72742.90058.0230
    (h)6.30793.61526.63343.61523.20609.5492
    Mean6.69994.93407.93494.52876.456311.3947
    Table 3. Comparison of PSNR by 6 methods for 8 color images
    Jipeng Yang, Jiulun Fan. Circular Histogram Breakpoint Selection and Threshold and Color Image Segmentation Method Based on Information Energy[J]. Laser & Optoelectronics Progress, 2023, 60(2): 0233002
    Download Citation