
Mohamed Shalaby, Fawzi S. Alorifi. Environmental pollution detection: A novel chirped spectral modulation algorithm for a more accurate monitoring of gas pollutants in the atmosphere[J]. Journal of the European Optical Society-Rapid Publications, 2023, 19(1): 2023005
Journals >Journal of the European Optical Society-Rapid Publications >Volume 19 >Issue 1 >Page 2023005 > Article
- Journal of the European Optical Society-Rapid Publications
- Vol. 19, Issue 1, 2023005 (2023)
Abstract
Keywords
1 Introduction
Preserving the environment is one of the most important necessities of scientific research, which includes the atmosphere, water resources, and agricultural soil. With industrial progress, the importance of early detection of different types of pollutants increases, and this requires high accuracy and sensitivity [
The atmosphere in which we live, and all our activities take place, should be kept always clean. We should ensure that it is free from pollutants and substances harmful to human health. What we gain from exercises on the health of our brains is lost due to air pollution. There are still quite limited research results on this aspect to help protect the environment. Regular monitoring of atmosphere purity is very important; therefore, atmospheric air should be checked to control the level of pollutants in it. Developing more accurate techniques for the detection of harmful gases in the atmosphere below the safe levels recommended by governmental agencies, leads to knowing the sources of pollution before the problem worsens and spreads from one region to another, causing harm to humanity, and containing the problem before it escalates. Harmful gases that may exist in the atmosphere result from human activities and sometimes by nature, such as volcanoes. Focusing on human activities, the sources, and bad effects of each of these gases are presented along with their recommended safe levels.
The recommended level of amount of NO2 and SO2 suggested by WHO “World Health Organization” is 25 μg/m3. It is known that up to 50 ppb (60 μg/m3) of carbon monoxide can be approved by government agencies in air [
Nitrogen dioxide is considered as one of the most dangerous air polluting substances. Burning of fuel in motor vehicles, power plants, and some industrial processes release NO2. Human health is endangered due to exposure to NO2. Inhaling air polluted with high levels of NO2 affects the respiratory and circulatory systems and the brain, causing death. Motor vehicles and industries based on fossil fuel consumption are the major drivers of NO2 pollution in the most polluted cities. Decision makers must embark on a shift from private vehicles to public transportation that uses clean energy.
Sulfur dioxide is a toxic agent. Air polluted by SO2 may cause stroke, cardiovascular disease, lung cancer, and eventually death. Burning of fossil fuels in vehicles, power plants, and some industrial processes release SO2 in the atmosphere. Volcanoes and extraction of metals may cause production of SO2. The conversion of sulfur dioxide into PM2.5 affects the health of millions of people. These suspended particulates are 25–100 times thinner than a human hair and therefore we cannot see it. The reason why these particles are very harmful to human health is their ability to go through respiratory organs and then to blood stream. The most efficient and easiest way to reduce PM2.5 levels is to install flue-gas desulfurization FGD units. Installed FGD units are critical in the process of reducing SO2 emissions from power plants as they form a significant fraction of total PM2.5 pollution at different locations. Inhalation of PM2.5 particles causes eyes, nose, and throat irritation. It causes coughing, sneezing and shortness of breath. Long term exposure to PM2.5 can cause permanent respiratory problems such as asthma, chronic bronchitis and heart disease [
High concentrations of sulfur oxides destroy vegetation and contribute to acid rain which can harm sensitive ecosystems. Sulfur oxides can react with other compounds in the atmosphere to form fine particles that reduce visibility, and damage statues and monuments.
Rules should be imposed to reduce emissions of SO2 and pollutants that form sulfur oxides (SOx) to help meet the air quality standards. Areas where the air quality does not meet these standards should be identified in order to develop plans to reduce the amount of SO2 in the air.
Carbon monoxide is released from burning of fuels. Carbon monoxide high levels may cause poisoning leading to risks such as permanent brain damage, and even death due to the replacement of oxygen by carbon monoxide in red blood cells. Carbon monoxide causes also death of fetal of pregnant women.
On the other hand, carbon dioxide which is also released from industrial activities and burning of fuels causes greenhouse effect and ocean acidification.
Since the safe percentage of the presence of air pollutants in air is very small, a new, more accurate method for detecting these pollutants that differs from the existing methods is to be discovered.
It is a mandatory today to detect and determine the quantity of very small amounts of chemical contaminants down to or less than the safe levels of these substances. Moreover, this process of detection should be quick enough and cheap so that the state of the purity of the air can be constantly monitored around the clock and in any spot on the planet. Along with the development in the measuring instruments used in the detection of substances, this must be accompanied by a development in the analysis to be more accurate and sensitive. The main feature in adopted pattern recognition techniques is their suitability for the accurate determination of mixtures components and their concentrations. The challenge facing these techniques is that these chemicals have similar spectra with some overlap. Therefore, these pattern recognition techniques should be developed to resolve the considerable spectral overlap and despite that, giving a correct result about the lowest possible limits for the amounts of environmental pollutants. Among the other advantages of these methods, in addition to accuracy, speed, and cheapness, is the determination of the components without previous separation. Least square methods have been used in several studies for the determination of different components in solutions. One of the adopted techniques to find the concentration of very small traces of oil in wastewater to a better accuracy is by transforming the absorption spectra of water and oil into vectors [
The paper is organized as follows; first the analysis of the new algorithm is presented, then it is tested on samples of air contaminated with known percentages of harmful gases which are SO2, NO2, CO, and CO2. The results of the new algorithm are compared with those of the CLS approach. Then the new algorithm is used to measure the level of polluting gases in an industrial zone, and at the exit and in the middle of a road tunnel. The bases of infrared spectroscopy are presented in
2 Methods
In this work, a new algorithm is designed that is capable of the determination of concentrations of the constituents in mixtures with better accuracy since it is based on mitigating the problem of the partial overlap between the absorption spectra of these substances. This study focuses on NO2 and SO2 due to their partial spectral overlap with other components of the air.
The idea is based on modulating the absorption spectrum of these substances in such a way to minimize the effect of this spectral overlap on the determination of each substance concentration in a mixture. The advantage of this proposed technique, in addition to the advantages of existing least squares methods, is its ability to find more accurately smaller traces of unknown components in presence of unexpected substances in the examined mixture. This new technique is suitable for the determination of environmental pollutants [
This new algorithm is tested on samples to check its capability of detecting traces of carbon monoxide, carbon dioxide, nitrogen dioxide, and sulfur dioxide present in air besides other contaminants. Then the new algorithm is used to analyze air samples at an industrial zone during 8 weeks and in the middle and at the exit of a road tunnel in Riyadh area to ensure that their amounts are within the safety ranges.
3 Proposed chirped spectral modulation algorithm
The new method relies on modulating the absorption spectra of the substances in a mixture. Modulation is realized by multiplying the absorption spectra by a signal sinusoidally varying with wavenumber. The frequency of this modulating function is chirped and adjusted in order to accurately calculate the concentrations of these substances. The absorption spectrum of each substance is modulated in this manner and the same is carried out for the absorption spectrum of the mixture which is under analysis. A set of equations is constructed from which the unknown concentrations of the substances are determined.
Since the absorption spectrum of each substance resembles the fingerprint of a human being so that it is impossible for the absorption spectrum of a substance to be similar to that of another substance. Therefore, using this new algorithm, a modified absorption pattern after chirped spectrum modulation is obtained which is less likely to bear a resemblance to that of another substance. Moreover, identification of larger molecules is easier with absorption spectroscopy techniques. The larger the molecule, the more bonds it contains, and thus absorption occurs from this molecule at more wavenumbers.
The spectral absorption pattern is used to calculate a variable representing the absorption spectral summation of substance “j”, in a mixture, using the following equation as
In case of existing spectral absorption overlap between substances “j” and “p”, the calculated concentration of substance “j” or substance “p” will not be correct. The weighting function, υr, where r is a parameter, and the parameter φ, in equations
The summation is carried out over the whole spectrum (448–3980 cm−1) and this absorption spectrum of all the components in the mixture serves to find the concentration of each substance in this mixture.
After measuring the absorption spectrum of the mixture under study, a variable is calculated for each expected substance in this mixture as follows
We can construct the following matrix equation
4 Test of the validity of the new algorithm
Initially, a focus was placed on some air pollutants produced by activities in industrial zones such as carbon dioxide, carbon monoxide, sulfur dioxide, and nitrogen dioxide. The absorption spectrum of these substances in the mid-infrared range is obtained from Spectra plot [
To test the ability of the new method to detect the proportions of the substances in a mixture, the spectrum of a sample of air containing percentage of these pollutants is prepared numerically, to know the lowest percentage that the new method can accurately detect in presence of a lot of other pollutants. An amount of water vapor (4 × 10⁻³ percentage in volume) is added to the mixture representing the unknown substance in the mixture denoted by matrix U in equations
![]()
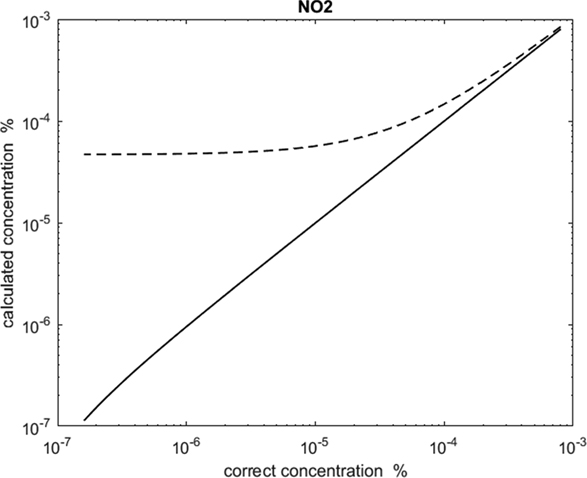
Figure 1.The amount of nitrogen dioxide detected versus the amount previously added, both by the CLS method (dashed) and by our new algorithm (solid). The curves show that the new algorithm shows a linear response down to better than 4.5 × 10⁻⁷% whereas the CLS approach is linear down to about 4 × 10⁻⁵%.
![]()
Figure 2.The amount of sulfur dioxide detected versus the amount previously added to the mixture, both by the CLS method (dashed) and by CSM algorithm (solid). The curves show that the new algorithm reveals a linear response down to around 7.8 × 10⁻⁶% whereas the CLS approach is linear down to about 2.5 × 10⁻⁴%.
![]()
Figure 3.The amount of carbon monoxide detected versus the amount previously added, both by the CLS method (dashed) and by CSM algorithm (solid). The two approaches show good behavior down to 1.7 × 10⁻⁶%.
![]()
Figure 4.The amount of carbon dioxide detected versus the amount previously added, both by the CLS method (dashed) and by CSM algorithm (solid). The two approaches show nearly the same behavior down to 2 × 10⁻³%.
5 Experimental results and discussions
The analysis is carried out using the FTIR MB3000 spectrometer operating in the mid IR range with a gas cell of 14 m path length. Since the percentage of pollutants in the air sample in our case is very small, five samples are considered, at different instants, and the average of their spectral absorbance is calculated to minimize the error. Moreover, the absorption spectrum over the range from 448 to 3980 cm−1 is measured in the following wavenumber intervals 448–1200, 1200–1500, 1500–2700, 2700–3000, and 3000–3980 cm−1. The gain of the detector circuit is adjusted in an interval in such a manner to increase sensitivity without running into detector saturation. Finally, these measurements are grouped in one file prior to applying the new algorithm on it. It is relied on the dynamic range, the signal to noise ratio, and the sensitivity of the FTIR spectrometer used to detect the small traces of pollutants in the atmosphere.
Monitoring air pollution in an industrial area
An industrial zone is chosen to examine the percentage of pollutants in air during 8 weeks. The instant of analyzing the air is at the peak of factories and workshops activities during the day. It should be noted that lifetime of NO2 and SO2 is less than 1 day since they are active gases.
The absorbance spectrum of the sample is analyzed using our new algorithm, it was possible to detect traces of carbon monoxide, carbon dioxide, and sulfur dioxide as shown in
![]()
Figure 5.The results of the field study which has been conducted by analyzing samples from an industrial zone in 8 weeks to monitor the level of air pollutants. The absorbance spectrum of these samples is measured using FTIR MB3000 spectrometer. Then, the CSM algorithm is applied to the obtained absorbance spectrum to determine the amount (ppm) of SO2, NO2, and CO in these samples.
Moreover, the concentration of CO2 during 8 weeks is calculated using CSM algorithm as shown in
Monitoring air pollution in the middle and at the exit of a tunnel
![]()
Figure 6.The results of the field study which has been conducted by analyzing samples from an industrial zone in 8 weeks to monitor the level of air pollutants. The absorbance spectrum of these samples is measured using FTIR MB3000 spectrometer. Then, the CSM algorithm is applied to the obtained absorbance spectrum to determine the amount (ppm) of CO2 in these samples.
The same procedure is carried out by examining air constituents searching for the concentrations of SO2 and NO2 in the middle and at the exit of a tunnel at the rush hour (peak of traffic clogging). This tunnel, in center of Riyadh area, is 3 lanes width, 830 m long and equipped with air ventilators distributed along the tunnel
![]()
Figure 7.An aerial view showing the location of the road tunnel in Riyadh city.
According to the analysis of this survey results, and even though the registered values of polluting gases are below the safe thresholds in case of short periods of exposure, the following recommendations are of great importance:
Follow-up the periodic inspection of flue gas desulfurization filters installed on factors chimneys. Emission standards should be strengthened and flue gas pollution control technology on coal-fired power plants, smelters, and other major industrial SO2 emitters should be implemented.
Not licensing factories unless they submit proof of amount of emissions in the safe range.
The gradual shift towards electric cars in order to reduce carbon dioxide emissions and to get rid of the global warming phenomenon that haunts the world and threatens to melt the ice in the polar regions and to reduce the levels of SO2 and NO2 pollution. It’s very urgent that governments transfer investments in fossil fuels towards safer energy sources, such as wind and solar.
Helping factories owners replace their old machines and install new environmentally friendly technologies through soft loans.
Raise factories owners’ awareness to adopt new technological methods reducing air pollutants.
Periodic monitoring of level of pollutants in the atmosphere.
The education of management and staff of factories is also a critical part of a successful health protection from dangerous effects of atmospheric pollutants.
In summary, it is believed that this new technique, compared to classical pattern recognition techniques, is able to determine the concentration of very small amounts of substances in a mixture containing the main constituents in addition to traces of other unexpected substances. The strength of this algorithm is attributed to the increased discrimination between substances, whose spectra is partially overlapping, by multiplying their spectra by an additional function. The function chosen is composed of a weighting function and a cosine function. The cosine function modulates the absorption spectrum with a frequency which will be tailored for more discrimination between the substance’s absorption spectra. This algorithm reduces the effect of the other unidentified substances in the mixture.
6 Conclusions
The new algorithm validity is tested by comparing its results with other algorithms based on classical least squares. The test is run on mixtures with different constituents. It was found that the novel algorithm is more sensitive to detect traces of pollutants in a mixture in presence of other components and gives more accurate concentration values.
The new spectrum modulation algorithm used allows us to detect very small traces of carbon monoxide, nitrogen dioxide, and sulfur dioxide in air in an industrial zone and at the exit of a road tunnel in Riyadh area. The amounts of these polluting substances are well below the internationally recommended levels.
References
[1] E. Baszanowska, Z. Otremba. Spectral signatures of fluorescence and light absorption to identify crude oils found in the marine environment.
[2] K. Haule, M. Darecki, H. Toczek. Light penetration in seawater polluted by dispersed oil: results of radiative transfer modelling.
[3] B. Troia, V.M.N. Passaro. Investigation of a novel silicon-on-insulator Rib-Slot photonic sensor based on the vernier effect and operating at 3.8 mm.
[4] Y.J. Kim, U. Platt.
[5] A. Jantrania. Dealing with oil and grease in restaurant wastewater.
[6] M.B. Hadley, R. Vedanthan, V. Fuster. Air pollution and cardiovascular disease: a window of opportunity.
[7] A.R.M. Shalaby, K.A. AlMuhanna, M. Shalaby. Environmental pollution monitoring: a novel vectorial algorithm technique for oil detection in wastewater.
[9] T. Holloway, D. Miller, S. Anenberg, M. Diao, B. Duncan, A.M. Fiore, D.K. Henze, J. Hess, P.L. Kinney, Y. Liu, J.L. Neu, S.M. O’Neill, M.T. Odman, R.B. Pierce, A.G. Russell, D. Tong, J.J. West, M.A. Zondlo. Satellite monitoring for air quality and health.
[10] J.F. Martínez-Trinidad, J.A. Carrasco-Ochoa, C. Brants, E.R. Hancock.
[11] P.R. Griffiths. Recent applications of Fourier transform infrared spectrometry in chemical and environmental analysis.
[12] G. Yoon, Y.-J. Kim, S. Hahn. Determination of glucose in whole blood samples by mid-infrared spectroscopy.
[13] T. Yano, T. Funatsu, K.-I. Suehara, Y. Nakano. Measurement of the concentrations of glucose and citric acid in the aqueous solution of a blood anticoagulant using near infrared spectroscopy.
[14] R. Vonach, J. Buschmann, R. Falkowski, R. Schindler, B. Lendl, R. Kellner. Application of mid-infrared transmission spectrometry to the direct determination of glucose in whole blood.
[15] P. Bhandare, Y. Mendelson, R.A. Peura, G. Janantsch, J.D. Kruse-Jarres, R. Marbach, M.H. Heise. Multivariate determination of glucose in whole blood using partial least-squares and artificial neural networks based on mid-infrared spectroscopy.
[16] H. Zeller, P. Novak, P. Landgraf. Blood glucose measurement by infrared spectroscopy.
[17] I. Cirne, J. Boaventura, Y. Guedes, E. Lucas. Methods for determination of oil and grease contents in wastewater from the petroleum industry.
[18] C.S. Goldenstein, V.A. Miller, R. Mitchell Spearrin, C.L. Strand. SpectraPlot.com: integrated spectroscopic modelling of atomic and molecular gases.
[19] D. Haaland, R. Easterling, D. Vopicka. Multivariate least-squares methods applied to the quantitative spectral analysis of multicomponent samples.
[20] P.R. Griffiths, B.T. Bowie. Measurement of the sensitivity and photometric accuracy of FT-IR spectrometers.
[21] D.A. Burns, E.W. Ciurczak.
[22] E. Oran Brigham.
[23] P.R. Griffiths, J.A. de Haseth.
[24] T. Hirschfeld. Dynamic range improvement in Fourier transform infrared spectrometry.
[25] M.K. Antoon, J.H. Koenig, J.L. Koenig. Least-squares curve-fitting of Fourier transform infrared spectra with applications to polymer systems.
[26] H. Martens, T. Naes.
[27] M.A. Arnold, L. Geng, X. Zhou, G.W. Small. Multivariate calibration models based on the direct analysis of near-infrared single-beam spectra.


Set citation alerts for the article
Please enter your email address

© Copyright 2018-2021 | Chinese Laser Press. All Rights Reserved 沪ICP备15018463号-20