
Qibao Ji, Wenyan Wang, Shuaifeng Zhang, Lü Yifan, Jingpei Xie, Aiqin Wang, Pei Liu. Numerical Simulation Analysis of TA2 Industrial Pure Titanium Laser Welding[J]. Laser & Optoelectronics Progress, 2022, 59(17): 1714011
- Laser & Optoelectronics Progress
- Vol. 59, Issue 17, 1714011 (2022)
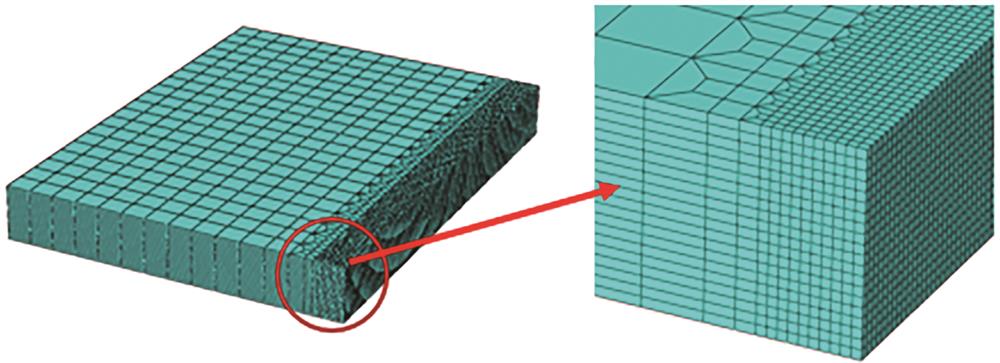
Fig. 1. Model of the meshing
![Heat source model. (a) Gaussian surface heat source; (b) cone heat source[20]](/richHtml/lop/2022/59/17/1714011/img_02.jpg)
Fig. 2. Heat source model. (a) Gaussian surface heat source; (b) cone heat source[20]
Fig. 3. Mechanical boundary conditions for finite element models
Fig. 4. Weld morphology obtained by experiment and simulation
Fig. 5. Temperature field distribution of welding process. (a) t=0.2 s; (b) t=0.8 s; (c) t=1.6 s; (d) t=2.0 s
Fig. 6. Schematic diagram of welding thermal cycle curve taking points. (a) Top surface; (b) weld cross section
Fig. 7. Thermal cycle curves of different nodes. (a) Welding direction; (b) depth direction; (c) weld direction
Fig. 8. Influence of process parameters on the maximum temperature. (a) Influence of power on maximum temperature; (b) influence of welding speed on maximum temperature
Fig. 9. Relationship between process parameters and cooling rate. (a) Relationship between laser power and cooling rate; (b) relationship between laser power and cooling rate in the range of 882-1827 ℃; (c) relationship between welding speed and cooling rate; (d) relationship between welding speed and cooling speed in the range of 882-1827 ℃
Fig. 10. Stress distribution. (a) Longitudinal residual stress (b) transverse residual stress
Fig. 11. Residual stress distribution along the weld direction. (a) Longitudinal residual stress; (b) transverse residual stress
| ||||||||||||||||||||||||||||||||||||||||||||||||||||||||||||||||||
Table 1. Weld dimensions obtained by experiment and simulation


Set citation alerts for the article
Please enter your email address

© Copyright 2018-2021 | Chinese Laser Press. All Rights Reserved 沪ICP备15018463号-20