• Journal of the European Optical Society-Rapid Publications
  • Vol. 19, Issue 1, 2023026 (2023)
Flavie Gillant1, Julien Moreau1, Maximilian U. Richly2, Antigoni Alexandrou2..., Karen Perronet1,3 and Nathalie Westbrook1,*|Show fewer author(s)
Author Affiliations
  • 1Université Paris-Saclay, Institut d’Optique Graduate School, CNRS, Laboratoire Charles Fabry, 91127 Palaiseau, France
  • 2Laboratoire d’Optique et Biosciences, Ecole Polytechnique, CNRS, INSERM, Université Paris-Saclay, 91128 Palaiseau, France
  • 3Université Paris-Saclay, Ecole Normale Supérieure Paris-Saclay, CNRS, CentraleSupélec, LuMIn, 91190 Gif-sur-Yvette, France
  • show less
    DOI: 10.1051/jeos/2023026 Cite this Article
    Flavie Gillant, Julien Moreau, Maximilian U. Richly, Antigoni Alexandrou, Karen Perronet, Nathalie Westbrook. Accurate calibration of optical tweezers close to a glass surface using interference rings in backscattered light[J]. Journal of the European Optical Society-Rapid Publications, 2023, 19(1): 2023026 Copy Citation Text show less
    Experimental setup. Dashed lines on AODy, AODx, L5, BFP and QPD represent conjugated planes. A half wave plate (HWP) maximizes transmission through the polarizing beamsplitter cube (PBS). The trap beam is reflected by a dichroic mirror (Chroma 725 DCSPXR) that also transmits the white light used to image the trapped bead on the CCD camera (U-Eye, UI 2240 SE MGL). A quarter wave plate (QWP) ensures that the backscattered light from the trapped bead, as shown in the insert, is reflected by the PBS and detected on either a QPD or a CCD camera. The interference pattern shown is observed when using the CCD camera. Focal lengths are: f1 = f2 = f3 = 150 mm, f4 = 200 mm, f5 = f6 = 50 mm, f7 = 300 mm and f8 = 400 mm.
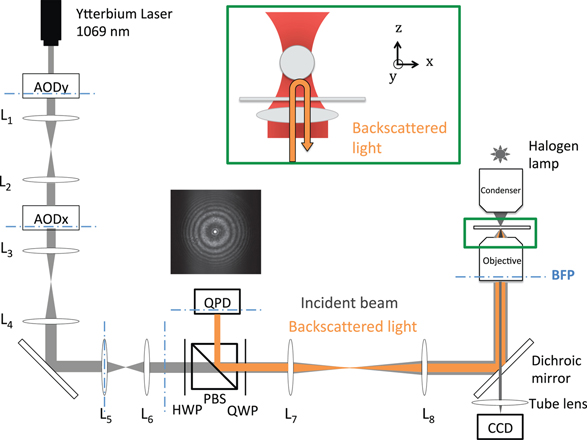
    Fig. 1. Experimental setup. Dashed lines on AODy, AODx, L5, BFP and QPD represent conjugated planes. A half wave plate (HWP) maximizes transmission through the polarizing beamsplitter cube (PBS). The trap beam is reflected by a dichroic mirror (Chroma 725 DCSPXR) that also transmits the white light used to image the trapped bead on the CCD camera (U-Eye, UI 2240 SE MGL). A quarter wave plate (QWP) ensures that the backscattered light from the trapped bead, as shown in the insert, is reflected by the PBS and detected on either a QPD or a CCD camera. The interference pattern shown is observed when using the CCD camera. Focal lengths are: f1 = f2 = f3 = 150 mm, f4 = 200 mm, f5 = f6 = 50 mm, f7 = 300 mm and f8 = 400 mm.
    Interference patterns observed in the back-focal plane of the objective at different distances d between the top surface of the coverslip and the bottom of the bead: (a) d = 5D, (b) d = 10D, (c) d = 15D. D is the period between two dark fringes at the center of the interference pattern. Image (d) was obtained at d = 5D with a phase contrast objective, showing the phase ring in its back focal plane. The white circles show the edge of the objective pupil, with a diameter of 5.2 mm.
    Fig. 2. Interference patterns observed in the back-focal plane of the objective at different distances d between the top surface of the coverslip and the bottom of the bead: (a) d = 5D, (b) d = 10D, (c) d = 15D. D is the period between two dark fringes at the center of the interference pattern. Image (d) was obtained at d = 5D with a phase contrast objective, showing the phase ring in its back focal plane. The white circles show the edge of the objective pupil, with a diameter of 5.2 mm.
    Calibration of the QPD in the xy plane. The linear fit gives the factor to convert raw data from the QPD into a distance in nm. Data was taken for a bead trapped at a height h = 2.7 μm above the coverslip surface with a laser power of 230 mW and an objective without phase ring. Error bars corresponding to the average over 10 data sets are within the width of the plotting symbols.
    Fig. 3. Calibration of the QPD in the xy plane. The linear fit gives the factor to convert raw data from the QPD into a distance in nm. Data was taken for a bead trapped at a height h = 2.7 μm above the coverslip surface with a laser power of 230 mW and an objective without phase ring. Error bars corresponding to the average over 10 data sets are within the width of the plotting symbols.
    Signal of the QPD in the xy plane for a displacement of the bead of 300 nm, versus trapped-bead height. The height is calculated from the number N of dark fringes observed from contact to the slide as h = ND + R, with D = 402 nm and R = 1.5 μm. The values obtained using the objective with a phase contrast ring (blue) or without (red) are compared.
    Fig. 4. Signal of the QPD in the xy plane for a displacement of the bead of 300 nm, versus trapped-bead height. The height is calculated from the number N of dark fringes observed from contact to the slide as h = ND + R, with D = 402 nm and R = 1.5 μm. The values obtained using the objective with a phase contrast ring (blue) or without (red) are compared.
    Power spectrum density as a function of frequency for laser powers of 140 mW (blue markers) and 650 mW (red markers). The solid lines are corresponding fits for frequencies above 100 Hz (blue) and above 200 Hz (red). Low frequency noise appears on the red curve as the first ten points below 200 Hz.
    Fig. 5. Power spectrum density as a function of frequency for laser powers of 140 mW (blue markers) and 650 mW (red markers). The solid lines are corresponding fits for frequencies above 100 Hz (blue) and above 200 Hz (red). Low frequency noise appears on the red curve as the first ten points below 200 Hz.
    Stiffness of the trap obtained with the step-response and the power spectrum analysis for different heights of the trapped bead, with or without taking into account Faxén’s correction for the viscous drag near the surface. Laser power at the entrance of the objective was fixed at 230 mW.
    Fig. 6. Stiffness of the trap obtained with the step-response and the power spectrum analysis for different heights of the trapped bead, with or without taking into account Faxén’s correction for the viscous drag near the surface. Laser power at the entrance of the objective was fixed at 230 mW.
    Stiffness of the trap obtained with the Bayesian inference and the equipartition methods, for different heights of the trapped bead. Laser power at the entrance of the objective was fixed at 230 mW.
    Fig. 7. Stiffness of the trap obtained with the Bayesian inference and the equipartition methods, for different heights of the trapped bead. Laser power at the entrance of the objective was fixed at 230 mW.
    Trap stiffness, obtained with the four calibration methods, as a function of the incident laser power, measured at the entrance of the objective. The height is fixed at 2.7 μm. For each calibration method, a linear fit is superimposed.
    Fig. 8. Trap stiffness, obtained with the four calibration methods, as a function of the incident laser power, measured at the entrance of the objective. The height is fixed at 2.7 μm. For each calibration method, a linear fit is superimposed.
    Flavie Gillant, Julien Moreau, Maximilian U. Richly, Antigoni Alexandrou, Karen Perronet, Nathalie Westbrook. Accurate calibration of optical tweezers close to a glass surface using interference rings in backscattered light[J]. Journal of the European Optical Society-Rapid Publications, 2023, 19(1): 2023026
    Download Citation