
Xu He, Yuncan Ma, Jun Li, Mingzhou Yuan, Meifang Yin, Limin Meng, Yan Ye, Hang Zhang, Jun Wu. Method and Application of Femtosecond Laser Processing on Non-Flat Surfaces[J]. Laser & Optoelectronics Progress, 2023, 60(17): 1714009
- Laser & Optoelectronics Progress
- Vol. 60, Issue 17, 1714009 (2023)

Fig. 1. Experimental setup for femtosecond laser processing
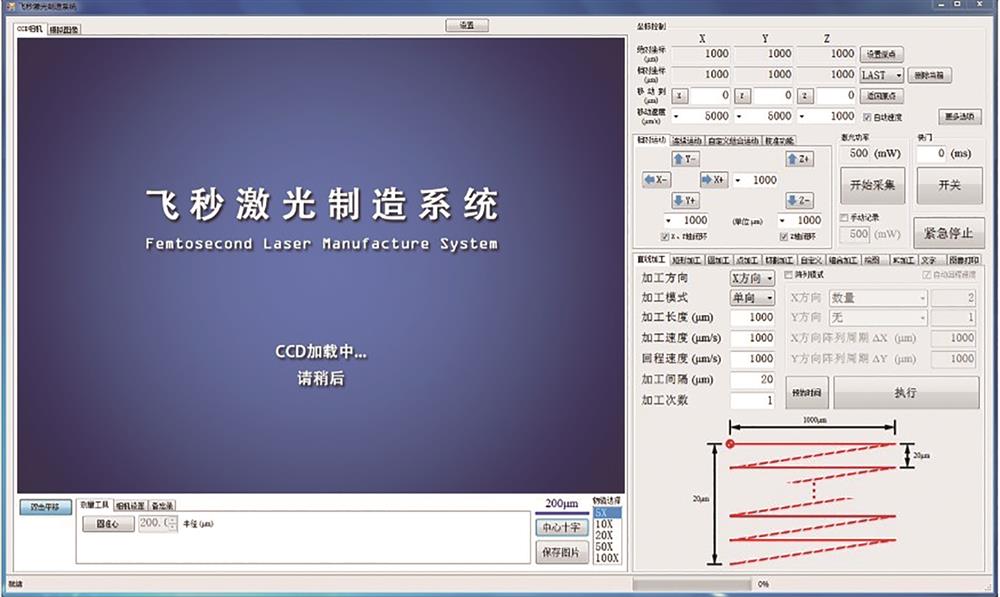
Fig. 2. Software interface of femtosecond laser processing system
Fig. 3. Results of the focus evaluation functions (fun 1‒fun 4 correspond to gray-level fluctuation function, gradient square function, Laplace gradient function, and quadratic gradient squared function)
Fig. 4. Schematic of correction by sub-regional plane fitting. (a) Original machining path; (b) sample surface; (c) corrected machining path; (d) flow chart of proposed method
Fig. 5. Schematic of sub-region division and sample points selection. (a) Divide into one rectangle region; (b) schematic of error calculation; (c) divide into rectangle regions by 2×2
Fig. 6. Schematic of correction by two-dimensional interpolation. (a) Original machining path; (b) sample surface; (c) corrected machining path; (d) flow chart of proposed method
Fig. 7. Schematic of femtosecond laser processing. (a) Single direction machining in Y direction; (b) double direction machining in XY directions
Fig. 8. Surface sampling point of sample 2 and results of plane fitting in each sub-region
Fig. 9. Surface microstructure machining results. (a) Photograph of experimental sample after machining; (b) schematic of characterization locations by SEM; (c) SEM image of sample 1; (d) SEM image of sample 2
Fig. 10. Groove width machining at different Z distances (
Fig. 11. Surface sampling point of sample 4 and intermediate points calculated by interpolation
Fig. 12. Result of micro-bulges machining. (a) Photograph of experimental sample after machining; (b) schematic of characterization locations by SEM; (c) SEM image of sample 3; (d) SEM image of sample 4
| |||||||||||||||||||||||||||||||||||||||||||||||||||||||
Table 1. Plane fitting data of experiment sample 2
| |||||||||||||||||||||||||||||||||
Table 2. Difference


Set citation alerts for the article
Please enter your email address

© Copyright 2018-2021 | Chinese Laser Press. All Rights Reserved 沪ICP备15018463号-20