• Photonics Research
  • Vol. 11, Issue 10, 1635 (2023)
Xiuyou Han†,*, Xinxin Su1,†, Meng Chao, Xindi Yang..., Weiheng Wang, Shuangling Fu, Yicheng Du, Zhenlin Wu and Mingshan Zhao|Show fewer author(s)
Author Affiliations
  • School of Optoelectronic Engineering and Instrumentation Science, Dalian University of Technology, Dalian 116024, China
  • show less
    DOI: 10.1364/PRJ.485157 Cite this Article Set citation alerts
    Xiuyou Han, Xinxin Su, Meng Chao, Xindi Yang, Weiheng Wang, Shuangling Fu, Yicheng Du, Zhenlin Wu, Mingshan Zhao, "Integrated photonic RF self-interference cancellation on a silicon platform for full-duplex communication," Photonics Res. 11, 1635 (2023) Copy Citation Text show less
    Structure of the integrated PSIC system and schematic spectra illustrating phase modulation and sideband filtering. PM, phase modulator; VOA, variable optical attenuator; TODL, tunable optical delay line; WDM, wavelength division multiplexer; OF, optical filter; PD, photodetector.
    Fig. 1. Structure of the integrated PSIC system and schematic spectra illustrating phase modulation and sideband filtering. PM, phase modulator; VOA, variable optical attenuator; TODL, tunable optical delay line; WDM, wavelength division multiplexer; OF, optical filter; PD, photodetector.
    (a) Optical microscope image of the integrated PSIC chip. (b) Cross-sectional schematic view (not to scale) of the silicon-on-insulator platform. (c) Packaged PSIC module. AGC, array grating coupler; TEC, thermo-electric cooler; FA, fiber array.
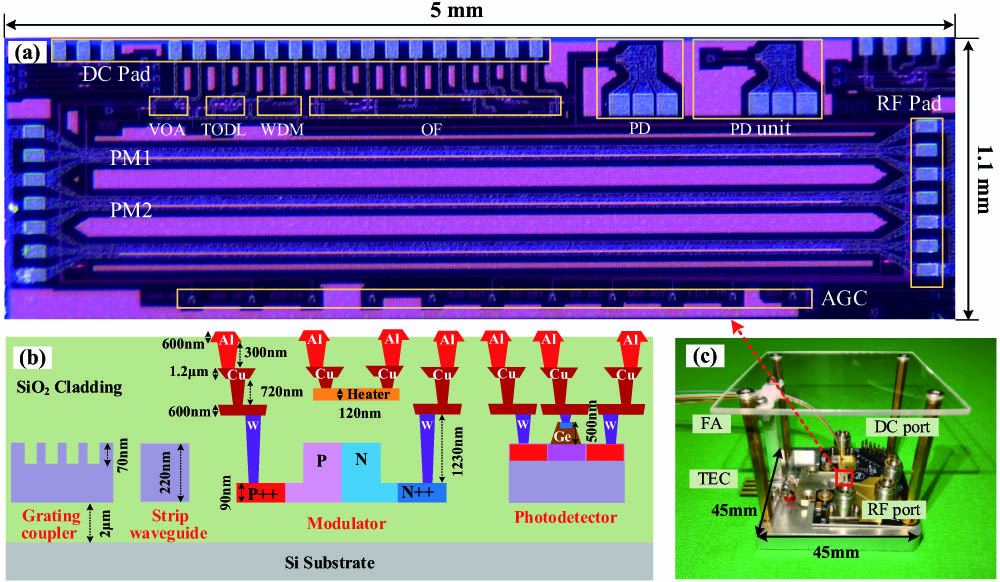
    Fig. 2. (a) Optical microscope image of the integrated PSIC chip. (b) Cross-sectional schematic view (not to scale) of the silicon-on-insulator platform. (c) Packaged PSIC module. AGC, array grating coupler; TEC, thermo-electric cooler; FA, fiber array.
    Measured results of VOA. (a) Variation curve of output optical power with applied DC power. (b) Measured optical spectrum of different applied powers over 2.54 nm bandwidth.
    Fig. 3. Measured results of VOA. (a) Variation curve of output optical power with applied DC power. (b) Measured optical spectrum of different applied powers over 2.54 nm bandwidth.
    Measured optical spectrum of TODL. (a) Intensity response under different regulation states. (b) Zoom-in view of (a) around 1550 nm. (c) Group delay response corresponding to different regulation states in (b).
    Fig. 4. Measured optical spectrum of TODL. (a) Intensity response under different regulation states. (b) Zoom-in view of (a) around 1550 nm. (c) Group delay response corresponding to different regulation states in (b).
    Transmission spectra of the WDM. (a) Simulated result. (b) Measured intensity response with different applied powers.
    Fig. 5. Transmission spectra of the WDM. (a) Simulated result. (b) Measured intensity response with different applied powers.
    Measured intensity and phase response of the OF.
    Fig. 6. Measured intensity and phase response of the OF.
    Measured O/E conversion response of the PD.
    Fig. 7. Measured O/E conversion response of the PD.
    Experiment setup to demonstrate the feasibility of the PSIC module for IBFD communication.
    Fig. 8. Experiment setup to demonstrate the feasibility of the PSIC module for IBFD communication.
    Optical spectrum of phase-modulated signals by sideband filtering.
    Fig. 9. Optical spectrum of phase-modulated signals by sideband filtering.
    S21 amplitude response of interference branch and reference branch.
    Fig. 10. S21 amplitude response of interference branch and reference branch.
    Cancellation depth characterization in C, X, Ku, and K bands.
    Fig. 11. Cancellation depth characterization in C, X, Ku, and K bands.
    Measured amplitude and phase differences between reference and interference branches. (a) fRF=12.4 GHz; (b) fRF=14.2 GHz.
    Fig. 12. Measured amplitude and phase differences between reference and interference branches. (a) fRF=12.4  GHz; (b) fRF=14.2  GHz.
    Output RF spectra in bandwidth of 100 MHz with and without cancellation and constellation diagram of SOI in bandwidth of 50 Msps. (a) fRF=12.4 GHz; (b) fRF=14.2 GHz.
    Fig. 13. Output RF spectra in bandwidth of 100 MHz with and without cancellation and constellation diagram of SOI in bandwidth of 50 Msps. (a) fRF=12.4  GHz; (b) fRF=14.2  GHz.
    Measured EVM of the recovered SOI with different powers of interference signal. (a) fRF=12.4 GHz; (b) fRF=14.2 GHz.
    Fig. 14. Measured EVM of the recovered SOI with different powers of interference signal. (a) fRF=12.4  GHz; (b) fRF=14.2  GHz.
    Measured EVM of SOI after PSIC system with different input powers. (a) fRF=12.4 GHz; (b) fRF=14.2 GHz.
    Fig. 15. Measured EVM of SOI after PSIC system with different input powers. (a) fRF=12.4  GHz; (b) fRF=14.2  GHz.
    Measured SFDR of the PSIC system without interference and with cancellation. (a) fRF=12.4 GHz; (b) fRF=14.2 GHz.
    Fig. 16. Measured SFDR of the PSIC system without interference and with cancellation. (a) fRF=12.4  GHz; (b) fRF=14.2  GHz.
    ReferencesProcess PlatformIntegration FunctionPhase Reversal MethodOperating FrequencyBandwidthCancellation Depth
    [32]InPSystemBPD400 MHz–6 GHz10–100 MHz30  dB
    [34]InPSystemBalun670 MHz20 MHz25  dB
    [35]SOILinear filterBPD5 GHz300 MHz20  dB
    [36]SOIModulatorDP-MZM7–20 GHzSingle frequency30  dB
    This workSOISystemPM+filtering5–25 GHz C, X, Ku, and K bands140–630 MHz20  dB
    Table 1. Performance Comparison of Integrated PSIC Schemes
    Xiuyou Han, Xinxin Su, Meng Chao, Xindi Yang, Weiheng Wang, Shuangling Fu, Yicheng Du, Zhenlin Wu, Mingshan Zhao, "Integrated photonic RF self-interference cancellation on a silicon platform for full-duplex communication," Photonics Res. 11, 1635 (2023)
    Download Citation