
Wenxue Zhang, Tianlong Man, Minghua Zhang, Hongqiang Zhou, Zenghua Liu, Yuhong Wan, "Multifunctional computational fluorescence self-interference holographic microscopy," Photonics Res. 12, 2703 (2024)
- Photonics Research
- Vol. 12, Issue 11, 2703 (2024)
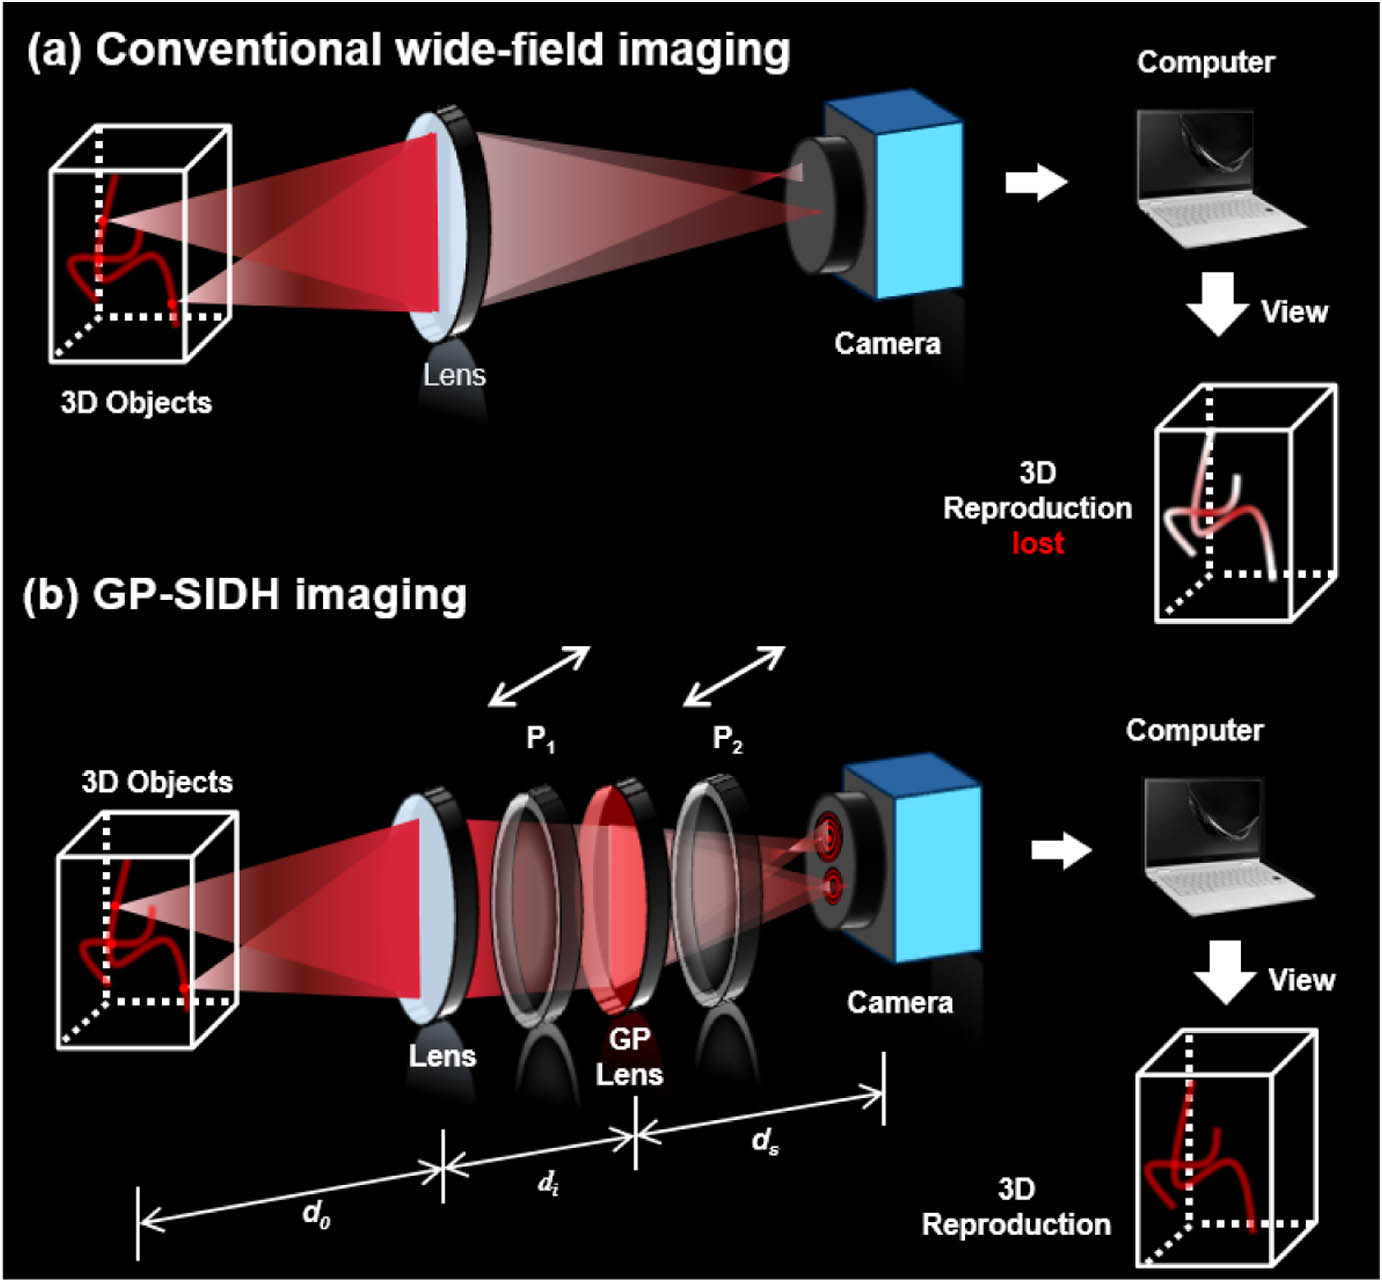
Fig. 1. Schematic illustration of a wide-field and GP-SIDH imaging system.

Fig. 2. Imaging schematic for multifunctional GP-SIDH microscopy. (a) The property of the GP lens. (b) The principle of the geometric phase shift. (c) The process of computational reconstruction.
Fig. 3. Schematic of the fluorescence holographic microscope. (a) Experiment setup. (b) Wide-field model images. (c) GP-SIDH model images, captured at different axial positions, respectively.
Fig. 4. Experimental results of fluorescent microspheres and resolution plate target. (a), (c) Recorded holograms, with different phase shifting values. (b) GP-SIDH refocused on different spatial depths. (d) GP-SIDH reconstruction results. (e) Wide-field images at different spatial depths. (f) Wide-field image on the focus. (g), (h) x y x z
Fig. 5. Aberration correction results. (a), (c) Uncorrected microsphere x y x z x y x z
Fig. 6. Imaging performance of the multifunctional microscope. (a)–(d) Reconstructed aberrated images, corrected images, edge images, wide-field images. (a1)–(d1) and (a4)–(d4) are the x y x z


Set citation alerts for the article
Please enter your email address

© Copyright 2018-2021 | Chinese Laser Press. All Rights Reserved 沪ICP备15018463号-20