
Miaomiao Hai, Yanping Liu, Ling Xiong, Guoqiang Li, Gao Wang, Hongfei Zhang, Jianwei Shuai, Guo Chen, Liyu Liu. A 3D biophysical model for cancer spheroid cell-enhanced invasion in collagen-oriented fiber microenvironment[J]. Chinese Physics B, 2020, 29(9):
- Chinese Physics B
- Vol. 29, Issue 9, (2020)

Fig. 1. The multiple stages of metastatic dissemination of spheroid from the primary tumor into the blood circulation. (i) Non-invasive tumor spheroid surrounded by collagen fibers (black). (II) Local invasion occurs on the cancer spheroid, and the collagen fibers surrounding the branches have orientation. (III) The cells at the front of the invading branch of the cancer spheroid invade the nutrient-rich blood vessels. Metastatic cancer cells rapidly invade by changing the orientation of collagen fibers.
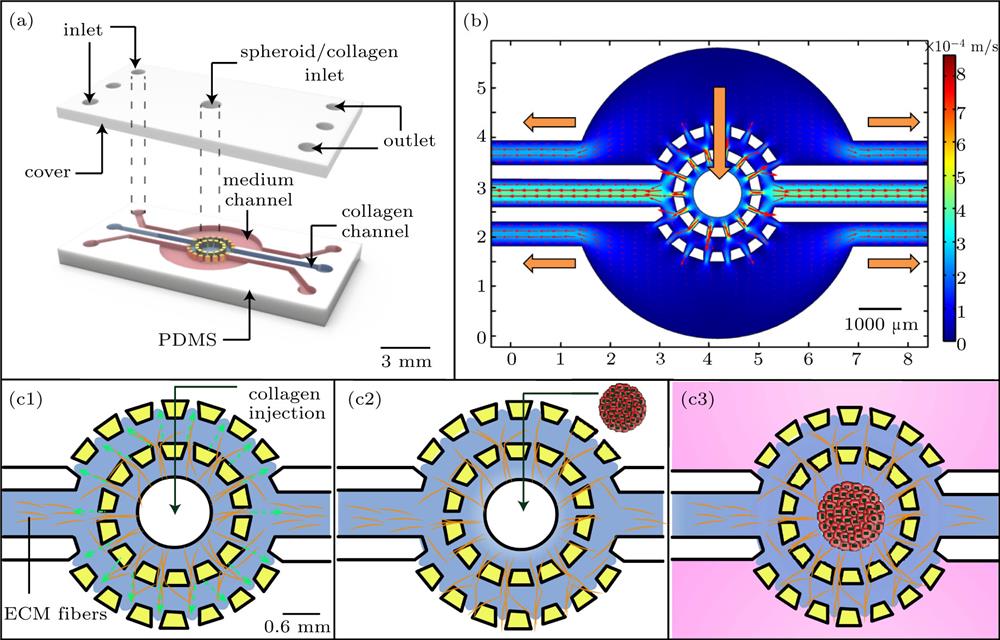
Fig. 2. The microchip design, flow field simulation, and experimental operation. (a) The 3D design of the chip. (b) Simulation result for complete flow field, showing the consistent flow field distribution of the chip. (c1)–(c3) Injection process for the collagen and spheroid (red). (c1) Injecting collagen into the chip from the middle hole (blue channel). (c2) Seeding spheroid into the collagen from the middle hole. (c3) Injecting medium from both channels to provide nutrition for cell invasion (pink channel).
Fig. 3. Orientation distribution of collagen fibers around the three-dimensional invasion experiment of spheroid in 96-well plate. (a) The confocal image of spheroid branches (green) and collagen fibers (red) at 24th hour. (b1) and (c1) The enlarged pictures of the “invasive branches” (blue box) and “non-invasive branches” (pink box) regions, respectively. (b2) and (c2) Statistics of orientation angle of collagen fibers in different parts around spheroid. The orientation distribution analysis of collagen fibers in the “invasive branches” (blue box) and “non-invasive branches” (pink box) regions, respectively.
Fig. 4. Experimental diagram of spheroid invasion at different times and data analysis of spheroid invasion in the chip. (a1)–(c1) The fluorescence and bright field merge picture of cancer cells at different times for MDA-MB-231 (green). (a2)–(c2) Experimental invasion of MDA-MB-231 cells at different times. (d) Quantitative treatment of cancer cell invasion. (d1) The binarization of the original fluorescence image. (d2) Boundary connection of image after binarization. (d3) The smoothed boundary is obtained original boundary via boundary smoothing. (d4) The curve of the ratio of the square of the spheroid perimeter to the sphere area with time and the curve of the standard deviation of the distance from the relative boundary to the center with time. From these two trajectories, the transition time can be determined to be 24 h. Scale bar denotes 200 μm.
Fig. 5. Analysis of the correlation between spheroid invasion branch cells and fibers in the chip. (a) Confocal image of collagen fibers (white) obtained in two-photon mode of inverted microscope and cancer cells (green) obtained in fluorescent mode at 90th hour. (b1) and (c1) Enlarged views of the invasion branches of two different parts of spheroid, respectively. (b2)–(b3), (c2)–(c3) Representation of the angle distribution of fiber and cell, the correlation between collagen fibers, and cells at the pink box and the blue box, respectively. The Y value is greater than 0.8 at time 0 hour, indicating that collagen fibers have strong correlation with cells.


Set citation alerts for the article
Please enter your email address

© Copyright 2018-2021 | Chinese Laser Press. All Rights Reserved 沪ICP备15018463号-20