Author Affiliations
1School of Physics and Electronic Information, Yunnan Normal University, Kunming 650500, Yunnan, China2School of Physics and Electronic Engineering, Qujing Normal University, Qujing 655011, Yunnan, Chinashow less
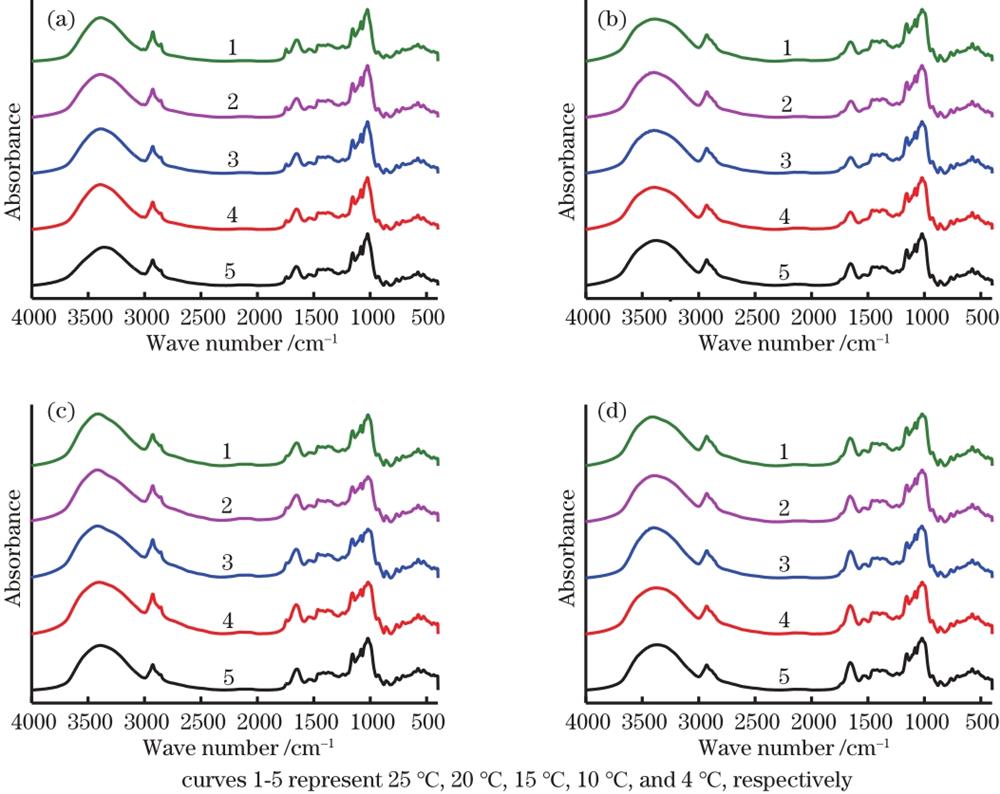
Fig. 1. Fourier transform infrared spectra of grain seeds germinated at different temperatures. (a) Quinoa; (b) highland barley; (c) rice; (d) wheat
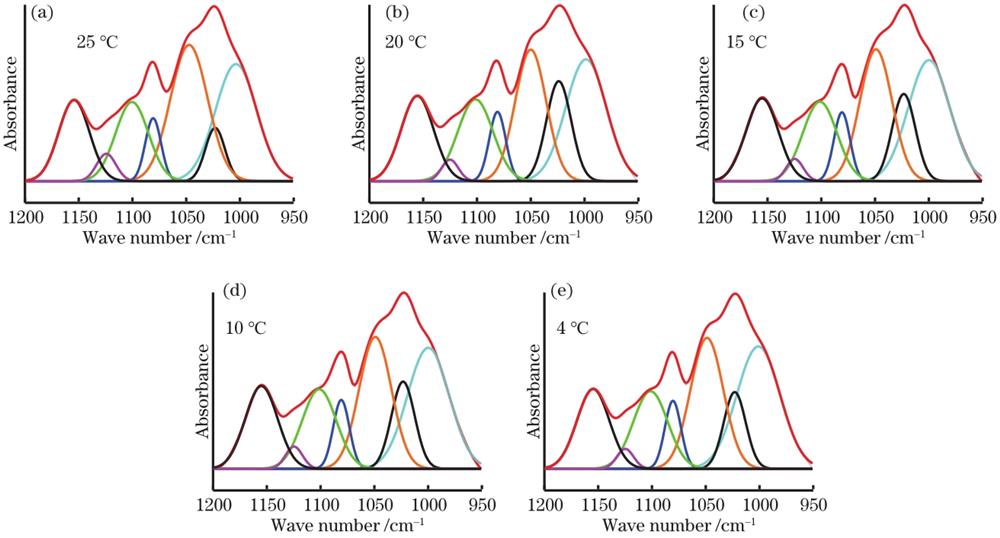
Fig. 2. Curve fitting spectra of quinoa seeds at different germination temperatures in the range of 1200-950 cm-1
Fig. 3. Curve fitting spectra of quinoa seeds at different germination temperatures in the range of 1700-1600 cm-1
| Grain varieties | Temperature |
|---|
| 25 ℃(CK) | 20 ℃ | 15 ℃ | 10 ℃ | 4 ℃ |
|---|
| Quinoa | 8±0.9 | 4±0.5 | 5±0.4 | 2±0.1 | 2±0.01 | | Highland barley | 52±3.6 | 52±3.1 | 40±2.6 | 22±1.8 | 18±1.5 | | Rice | 18±1.3 | 0 | 0 | 0 | 0 | | Wheat | 80±2.8 | 70±3.1 | 64±3.1 | 8±0.7 | 0 |
|
Table 1. Effects of low-temperature stress on germination potential of four grain seeds
| Grain varieties | Temperature |
|---|
| 25 ℃(CK) | 20 ℃ | 15 ℃ | 10 ℃ | 4 ℃ |
|---|
| Quinoa | 22±1.3 | 9±0.9 | 8±0.7 | 6±0.4 | 4±0.3 | | Highland barley | 96±3.9 | 92±4.3 | 86±2.3 | 78±2.8 | 74±3.0 | | Rice | 78±3.1 | 68±2.8 | 0 | 0 | 0 | | Wheat | 96±3.3 | 88±3.4 | 84±3.1 | 80±2.7 | 8±0.6 |
|
Table 2. Effects of low-temperature stress on the seed germination rate of fourgrain seeds
| Grain varieties | Temperature |
|---|
| 25 ℃(CK) | 20 ℃ | 15 ℃ | 10 ℃ | 4 ℃ |
|---|
| Quinoa | 12.56±1.00 | 5.63±0.02 | 5.32±0.04 | 5.24±0.03 | 1.67±0.01 | | Highland barley | 18.57±1.41 | 18.72±0.05 | 22.05±1.24 | 14.59±1.35 | 16.66±0.45 | | Rice | 2.85±0.05 | 0.18±0.02 | 0 | 0 | 0 | | Wheat | 33.36±0.71 | 32.24±1.48 | 24.78±1.20 | 11.81±0.75 | 10.52±0.41 |
|
Table 3. Effects of low-temperature stress on germination index of fourgrain seeds
| Wave number ν /cm-1 | Temperature |
|---|
| 25 ℃(CK) | 20 ℃ | 15 ℃ | 10 ℃ | 4 ℃ |
|---|
| 998 | 25.91 | 26.53 | 27.07 | 29.21 | 28.34 | | 1023 | 5.62 | 13.36 | 10.94 | 6.94 | 9.09 | | 1047 | 27.43 | 22.02 | 22.98 | 24.40 | 23.15 | | 1080 | 5.37 | 6.61 | 6.01 | 5.88 | 5.89 | | 1100 | 14.05 | 15.54 | 14.65 | 14.20 | 14.39 | | 1124 | 2.85 | 1.96 | 2.04 | 2.18 | 1.80 | | 1154 | 13.42 | 14.93 | 14.44 | 13.84 | 13.89 | | Total | 94.65 | 100.50 | 98.13 | 96.65 | 96.55 |
|
Table 4. Sub-peak positions and areas of quinoa seeds at different germination temperatures in the range of 1200-950 cm-1
| Wave number ν /cm-1 | Temperature |
|---|
| 25 ℃(CK) | 20 ℃ | 15 ℃ | 10 ℃ | 4 ℃ |
|---|
| 993 | 21.70 | 23.18 | 22.43 | 22.83 | 24.05 | | 1024 | 29.38 | 24.77 | 26.47 | 21.08 | 18.48 | | 1054 | 12.18 | 15.49 | 13.75 | 15.69 | 17.52 | | 1080 | 5.31 | 4.80 | 5.00 | 4.39 | 4.27 | | 1102 | 19.06 | 22.22 | 20.52 | 22.12 | 21.90 | | 1126 | 0.79 | 0.68 | 0.69 | 0.57 | 0.71 | | 1158 | 14.82 | 13.91 | 14.15 | 12.85 | 13.34 | | Total | 103.24 | 105.05 | 103.01 | 99.53 | 100.27 |
|
Table 5. Sub-peak positions and areas of highland barley seeds at different germination temperatures in the range of 1200-950 cm-1
| Wave number ν /cm-1 | Temperature |
|---|
| 25 ℃(CK) | 20 ℃ | 15 ℃ | 10 ℃ | 4 ℃ |
|---|
| 998 | 27.49 | 19.89 | 17.76 | 20.75 | 23.82 | | 1023 | 11.68 | 16.36 | 24.44 | 21.89 | 14.83 | | 1050 | 19.01 | 11.18 | 9.18 | 11.27 | 17.08 | | 1080 | 5.27 | 3.88 | 4.13 | 4.44 | 4.06 | | 1102 | 16.86 | 16.41 | 17.93 | 18.75 | 19.32 | | 1126 | 1.05 | 0.60 | 0.59 | 0.62 | 0.70 | | 1156 | 13.47 | 11.53 | 12.84 | 13.73 | 13.12 | | Total | 94.83 | 79.85 | 86.87 | 91.45 | 92.93 |
|
Table 6. Sub-peak positions and areas of rice seeds at different germination temperatures in the range of 1200-950 cm-1
| Wave number ν /cm-1 | Temperature |
|---|
| 25 ℃(CK) | 20 ℃ | 15 ℃ | 10 ℃ | 4 ℃ |
|---|
| 991 | 19.73 | 21.55 | 24.34 | 23.61 | 23.44 | | 1023 | 30.29 | 26.59 | 21.31 | 22.27 | 18.70 | | 1054 | 10.62 | 13.82 | 16.17 | 14.15 | 16.17 | | 1080 | 4.27 | 4.44 | 4.00 | 4.22 | 3.99 | | 1101 | 22.86 | 24.13 | 26.19 | 22.92 | 23.27 | | 1126 | 0.47 | 0.47 | 0.47 | 0.55 | 0.47 | | 1159 | 13.59 | 13.20 | 12.73 | 13.71 | 12.60 | | Total | 101.83 | 104.20 | 105.21 | 101.13 | 98.64 |
|
Table 7. Sub-peak positions and areas of wheat seeds at different germination temperatures in the range of 1200-950 cm-1
| Secondary structure | Temperature |
|---|
| 25 ℃(CK) | 20 ℃ | 15 ℃ | 10 ℃ | 4 ℃ |
|---|
| β-sheet | 4.36 | 3.69 | 3.62 | 4.89 | 4.95 | | α-helix | 3.40 | 3.13 | 3.09 | 2.79 | 2.41 | | Random coil | 0.89 | 0.78 | 1.76 | 0.28 | 2.59 | | β-turns | 3.33 | 2.85 | 2.97 | 3.67 | 0.90 | | Total | 11.98 | 10.45 | 11.44 | 11.63 | 10.85 |
|
Table 8. Secondary structure peak areas of quinoa seeds in the range of 1700-1600 cm-1 at different germination temperatures
| Secondary structure | Temperature |
|---|
| 25 ℃(CK) | 20 ℃ | 15 ℃ | 10 ℃ | 4 ℃ |
|---|
| β-sheet | 36.37 | 35.41 | 31.71 | 42.05 | 22.76 | | α-helix | 28.38 | 29.95 | 27.00 | 24.02 | 30.68 | | Random coil | 7.44 | 7.42 | 15.40 | 2.38 | 20.65 | | β-turns | 27.81 | 27.22 | 25.94 | 31.65 | 25.92 |
|
Table 9. Percentage of secondary structure peak areas of quinoa seeds in the range of 1700-1600 cm-1 at different germination temperatures
| Secondary structure | Temperature |
|---|
| 25 ℃(CK) | 20 ℃ | 15 ℃ | 10 ℃ | 4 ℃ |
|---|
| β-sheet | 3.09 | 5.16 | 3.10 | 3.07 | 3.36 | | α-helix | 2.89 | 1.99 | 3.05 | 2.02 | 4.55 | | Random coil | 2.13 | 1.40 | 0.49 | 0.95 | 0.32 | | β-turns | 2.57 | 2.95 | 2.76 | 3.07 | 2.75 | | Total | 10.68 | 11.50 | 9.40 | 9.11 | 10.98 |
|
Table 10. Secondary structure peak areas of highland barley seeds in the range of 1700-1600 cm-1 at different germination temperatures
| Secondary structure | Temperature |
|---|
| 25 ℃(CK) | 20 ℃ | 15 ℃ | 10 ℃ | 4 ℃ |
|---|
| β-sheet | 28.91 | 35.02 | 32.94 | 33.71 | 30.65 | | α-helix | 27.06 | 20.36 | 32.44 | 22.14 | 41.35 | | Random coil | 19.95 | 14.31 | 5.26 | 10.47 | 2.95 | | β-turns | 24.07 | 30.30 | 29.35 | 33.69 | 25.04 |
|
Table 11. Percentage of secondary structure peak areas of highland barley seeds in the range of 1700-1600 cm-1 at different germination temperatures
| Secondary structure | Temperature |
|---|
| 25 ℃(CK) | 20 ℃ | 15 ℃ | 10 ℃ | 4 ℃ |
|---|
| β-sheet | 3.54 | 4.02 | 3.97 | 4.60 | 3.50 | | α-helix | 3.70 | 3.37 | 4.05 | 5.07 | 4.28 | | Random coil | 1.79 | 1.47 | 1.66 | 1.32 | 3.02 | | β-turns | 2.56 | 3.33 | 3.20 | 4.16 | 2.35 | | Total | 11.59 | 12.19 | 12.88 | 15.15 | 13.15 |
|
Table 12. Secondary structure peak areas of rice seeds in the range of 1700-1600 cm-1 at different germination temperatures
| Secondary structure | Temperature |
|---|
| 25 ℃(CK) | 20 ℃ | 15 ℃ | 10 ℃ | 4 ℃ |
|---|
| β-sheet | 30.61 | 32.95 | 30.82 | 30.39 | 26.56 | | α-helix | 31.89 | 27.65 | 31.42 | 33.46 | 32.57 | | Random coil | 15.43 | 12.05 | 12.90 | 8.73 | 23.00 | | β-turns | 22.07 | 27.36 | 24.86 | 27.42 | 17.85 |
|
Table 13. Percentage of secondary structure peak areas of rice seeds in the range of 1700-1600 cm-1 at different germination temperatures
| Secondary structure | Temperature |
|---|
| 25 ℃(CK) | 20 ℃ | 15 ℃ | 10 ℃ | 4 ℃ |
|---|
| β-sheet | 5.29 | 4.31 | 5.27 | 5.52 | 5.64 | | α-helix | 4.52 | 6.63 | 7.23 | 7.06 | 7.05 | | Random coil | 0.88 | 0.09 | 0.22 | 0.18 | 0.31 | | β-turns | 5.11 | 3.59 | 4.30 | 4.62 | 4.74 | | Total | 15.80 | 14.62 | 17.02 | 17.38 | 17.74 |
|
Table 14. Secondary structure peak areas of wheat seeds in the range of 1700-1600 cm-1 at different germination temperatures
| Secondary structure | Temperature |
|---|
| 25 ℃(CK) | 20 ℃ | 15 ℃ | 10 ℃ | 4 ℃ |
|---|
| β-sheet | 33.47 | 29.50 | 31.00 | 31.78 | 31.76 | | α-helix | 28.60 | 45.30 | 42.45 | 40.63 | 39.77 | | Random coil | 5.56 | 0.62 | 1.30 | 1.01 | 1.77 | | β-turns | 32.36 | 24.58 | 25.25 | 26.57 | 26.69 |
|
Table 15. Percentage of secondary structure peak areas of wheat seeds in the range of 1700~1600 cm-1 at different germination temperatures