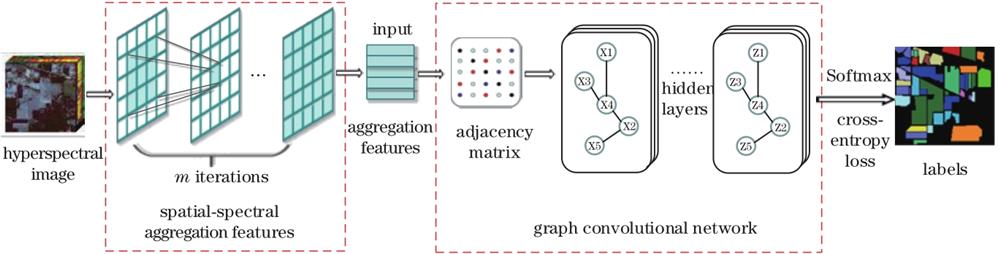
Fig. 1. Classification model of hyperspectral remote sensing images based on S2AF-GCN
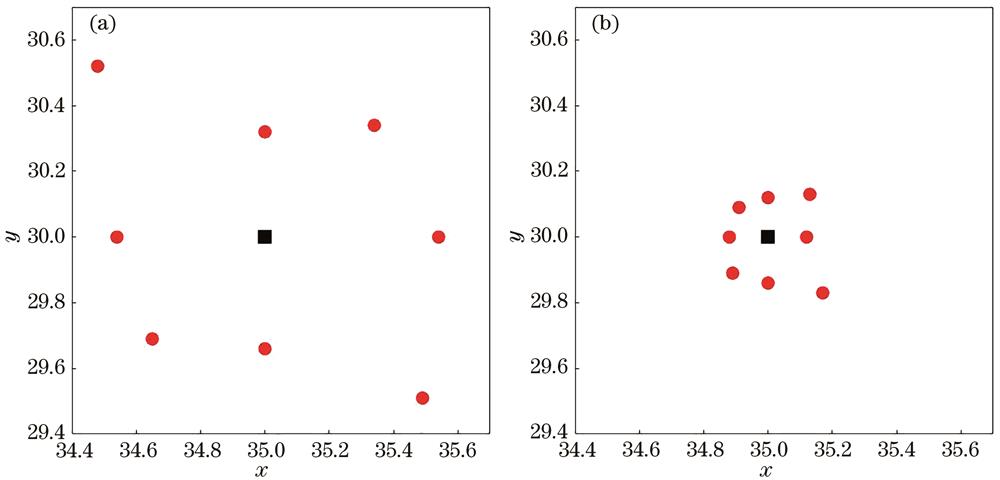
Fig. 2. Renderings of spatial neighborhood feature aggregation. (a) European distance calculated by original features; (b) European distance calculated by aggregation features
Fig. 3. Connections between nodes of different classes
Fig. 4. Comparison of composition based on original features and aggregation features. (a) Random samples; (b) 5 nearest neighbors from original features; (c) 5 nearest neighbors from aggregation features
Fig. 5. Algorithm flow of S2AF-GCN
Fig. 6. Classification results on Indian Pines dataset. (a) False color; (b) ground truth; (c) FuNet-C; (d) S2GCN; (e) GCN(OF); (f) GCN(AF); (g) S2AF-GCN(OF); (h) S2AF-GCN(AF)
Fig. 7. Classification results on Pavia University dataset. (a) False color; (b) ground truth; (c) FuNet-C; (d) S2GCN; (e) GCN(OF); (f) GCN(AF); (g) S2AF-GCN(OF); (h) S2AF-GCN(AF)
Fig. 8. Classification results on Kennedy Space Center dataset. (a) False color; (b) ground truth; (c) FuNet-C; (d) S2GCN; (e) GCN(OF); (f) GCN(AF); (g) S2AF-GCN(OF); (h) S2AF-GCN(AF)
Fig. 9. Influence of nearest neighbor number K on the overall accuracy on different datasets. (a) Indian Pines; (b) Pavia University; (c) Kennedy Space Center
Fig. 10. OA of different models under different proportions of training samples. (a) Indian Pines; (b) Pavia University; (c) Kennedy Space Center
| Class No. | Class name | Number of samples |
|---|
| Train | Test | Total |
|---|
| | 105(1%) | 10261 | 10366 | | 1 | Corn Notill | 14 | 1420 | 1434 | | 2 | Corn Mintill | 8 | 826 | 834 | | 3 | Corn | 3 | 231 | 234 | | 4 | Grass Pasture | 5 | 492 | 497 | | 5 | Grass Trees | 7 | 740 | 747 | | 6 | Hay Windrowed | 5 | 484 | 489 | | 7 | Soybean Notill | 9 | 959 | 968 | | 8 | Soybean Mintill | 24 | 2444 | 2468 | | 9 | Soybean Clean | 6 | 608 | 614 | | 10 | Wheat | 2 | 210 | 212 | | 11 | Woods | 12 | 1282 | 1294 | | 12 | Buildings Grass Trees Drives | 4 | 376 | 380 | | 13 | Stone Steel Towers | 2 | 93 | 95 | | 14 | Alfalfa | 2 | 52 | 54 | | 15 | Grass Pasture Mowed | 1 | 25 | 26 | | 16 | Oats | 1 | 19 | 20 |
|
Table 1. Land cover category and dataset division on Indian Pines dataset
| Class No. | Class name | Number of samples |
|---|
| Train | Test | Total |
|---|
| | 427(1%) | 42349 | 42776 | | 1 | Asphalt | 66 | 6565 | 6631 | | 2 | Meadows | 186 | 18463 | 18649 | | 3 | Gravel | 21 | 2078 | 2099 | | 4 | Trees | 31 | 3033 | 3064 | | 5 | Metal Sheets | 13 | 1332 | 1345 | | 6 | Bare Soil | 50 | 4979 | 5029 | | 7 | Bitumen | 13 | 1317 | 1330 | | 8 | Bricks | 37 | 3645 | 3682 | | 9 | Shadows | 10 | 937 | 947 |
|
Table 2. Land cover category and dataset division on Pavia University dataset
| Class No. | Class name | Number of samples |
|---|
| Train | Test | Total |
|---|
| | 52(1%) | 5159 | 5211 | | 1 | Scrub | 8 | 753 | 761 | | 2 | Willow swamp | 2 | 241 | 243 | | 3 | CP hammock | 3 | 253 | 256 | | 4 | Slash pine | 3 | 249 | 252 | | 5 | Oak/Broadleaf | 2 | 159 | 161 | | 6 | Hardwood | 2 | 227 | 229 | | 7 | Swap | 1 | 104 | 105 | | 8 | Graminoid marsh | 4 | 427 | 431 | | 9 | Spartina marsh | 5 | 515 | 520 | | 10 | Cattail marsh | 4 | 400 | 404 | | 11 | Salt marsh | 4 | 415 | 419 | | 12 | Mud flats | 5 | 498 | 503 | | 13 | Water | 9 | 918 | 927 |
|
Table 3. Land cover category and dataset division on Kennedy Space Center dataset
| Model | CNN feature extraction | Information used | Features used in constructing graph | Adjacency matrix |
|---|
| FuNet-C | 2DCNN | Spatial and spectral information | Original spectral features | Inaccurate | | S2GCN | No | Spatial and spectral information | Original spectral features | Inaccurate | | S2AF-GCN | No | Spatial and spectral information | Aggregation features | Accurate |
|
Table 4. Comparison of each method
| Model | Classify using original features | Classify using aggregation features | Construct adjacency matrix using original features | Construct adjacency matrix using aggregation features | Accurate adjacency matrix |
|---|
| GCN(OF) | √ | | √ | | × | | GCN(AF) | | √ | √ | | × | | S2AF-GCN(OF) | √ | | | √ | √ | | S2AF-GCN(AF) | | √ | | √ | √ |
|
Table 5. Comparison of similarities and differences of various methods in ablation experiment
| Class No. | FuNet-C | S2GCN | GCN(OF) | GCN(AF) | S2AF-GCN(OF) | S2AF-GCN(AF) |
|---|
| 1 | 81.20 | 83.10 | 61.27 | 67.11 | 81.83 | 82.18 | | 2 | 76.15 | 81.48 | 24.46 | 57.51 | 55.57 | 85.84 | | 3 | 89.61 | 98.27 | 39.83 | 47.62 | 51.52 | 60.17 | | 4 | 78.66 | 78.05 | 73.37 | 74.19 | 82.11 | 78.46 | | 5 | 71.76 | 92.43 | 85.54 | 87.43 | 89.05 | 99.05 | | 6 | 99.38 | 100.00 | 94.42 | 97.11 | 99.79 | 100.00 | | 7 | 73.30 | 82.59 | 61.94 | 87.17 | 78.83 | 88.22 | | 8 | 61.46 | 75.16 | 57.90 | 74.02 | 64.57 | 81.18 | | 9 | 46.88 | 78.13 | 31.41 | 39.80 | 59.05 | 70.07 | | 10 | 99.52 | 100.00 | 91.90 | 99.05 | 100.00 | 100.00 | | 11 | 96.80 | 99.22 | 95.16 | 94.38 | 97.58 | 98.75 | | 12 | 57.18 | 66.76 | 38.83 | 71.81 | 66.22 | 67.82 | | 13 | 83.87 | 86.02 | 80.65 | 80.65 | 77.42 | 88.17 | | 14 | 92.31 | 84.62 | 32.69 | 82.69 | 76.92 | 94.23 | | 15 | 72.00 | 92.00 | 36.00 | 92.00 | 80.00 | 100.00 | | 16 | 42.11 | 57.89 | 47.37 | 73.68 | 63.16 | 68.42 | | OA /% | 74.99 | 84.08 | 63.19 | 75.53 | 76.48 | 85.51 | | AA /% | 76.39 | 84.73 | 59.55 | 76.64 | 76.34 | 85.16 | | Kappa | 0.7181 | 0.8196 | 0.5823 | 0.7226 | 0.7317 | 0.8353 |
|
Table 6. Classification results on Indian Pines dataset
| Class No. | FuNet-C | S2GCN | GCN(OF) | GCN(AF) | S2AF-GCN(OF) | S2AF-GCN(AF) |
|---|
| 1 | 85.73 | 95.55 | 88.35 | 91.32 | 91.93 | 94.58 | | 2 | 99.20 | 98.26 | 95.79 | 95.72 | 98.60 | 99.13 | | 3 | 77.53 | 79.40 | 68.62 | 62.03 | 77.53 | 82.24 | | 4 | 57.73 | 86.55 | 90.74 | 92.35 | 89.85 | 89.99 | | 5 | 99.47 | 100.00 | 95.35 | 99.40 | 99.55 | 100.00 | | 6 | 75.34 | 89.54 | 74.11 | 89.27 | 90.72 | 98.77 | | 7 | 96.13 | 56.42 | 61.73 | 88.84 | 92.10 | 99.92 | | 8 | 85.27 | 91.85 | 82.36 | 97.31 | 95.58 | 98.86 | | 9 | 99.89 | 100.00 | 99.15 | 100.00 | 100.00 | 100.00 | | OA /% | 89.00 | 93.29 | 88.24 | 92.52 | 94.58 | 96.95 | | AA /% | 86.25 | 88.62 | 84.02 | 90.69 | 92.87 | 95.43 | | Kappa | 0.8511 | 0.9103 | 0.8429 | 0.9009 | 0.9278 | 0.9561 |
|
Table 7. Classification results on Pavia University dataset
| Class No. | FuNet-C | S2GCN | GCN(OF) | GCN(AF) | S2AF-GCN(OF) | S2AF-GCN(AF) |
|---|
| 1 | 98.41 | 100.00 | 92.96 | 96.95 | 95.22 | 98.94 | | 2 | 100.00 | 100.00 | 87.97 | 94.19 | 98.76 | 98.34 | | 3 | 45.06 | 100.00 | 82.21 | 90.91 | 70.36 | 100.00 | | 4 | 6.83 | 59.84 | 17.27 | 58.63 | 64.26 | 72.69 | | 5 | 90.57 | 100.00 | 61.01 | 62.26 | 92.45 | 97.48 | | 6 | 22.47 | 62.56 | 50.66 | 59.03 | 64.32 | 92.95 | | 7 | 40.38 | 69.23 | 37.50 | 46.15 | 40.38 | 76.92 | | 8 | 83.84 | 100.00 | 88.52 | 91.57 | 94.38 | 100.00 | | 9 | 83.69 | 83.69 | 84.85 | 83.11 | 89.90 | 83.69 | | 10 | 96.50 | 94.00 | 71.00 | 93.75 | 80.25 | 94.00 | | 11 | 100.00 | 100.00 | 80.24 | 87.47 | 87.23 | 97.11 | | 12 | 96.50 | 96.39 | 94.58 | 95.78 | 95.38 | 96.39 | | 13 | 100.00 | 100.00 | 99.78 | 99.46 | 100.00 | 100.00 | | OA /% | 84.09 | 93.35 | 82.05 | 88.41 | 88.58 | 94.92 | | AA /% | 74.16 | 89.67 | 72.97 | 81.48 | 82.53 | 92.96 | | Kappa | 0.8228 | 0.9259 | 0.7999 | 0.8707 | 0.8727 | 0.9435 |
|
Table 8. Classification results on Kennedy Space Center dataset
| Dataset | FuNet-C | S2GCN | S2AF-GCN |
|---|
| Indian Pines | 420 | 117 | 182 | | Pavia University | 963 | 133 | 240 | | Kennedy Space Center | 280 | 40 | 56 |
|
Table 9. Running time of FuNet-C, S2GCN, S2AF-GCN models on three datasets
| m+1 | Indian Pines | Pavia University | Kennedy Space Center |
|---|
| OA /% | AA /% | Kappa | OA /% | AA /% | Kappa | OA /% | AA /% | Kappa |
|---|
| 2 | 77.52 | 80.36 | 0.7451 | 93.98 | 92.34 | 0.9200 | 90.83 | 85.29 | 0.8978 | | 4 | 81.56 | 82.24 | 0.7912 | 95.89 | 94.57 | 0.9455 | 92.61 | 87.54 | 0.9177 | | 6 | 84.81 | 84.01 | 0.8276 | 96.42 | 95.52 | 0.9526 | 93.47 | 89.09 | 0.9272 | | 8 | 85.51 | 85.16 | 0.8353 | 96.65 | 95.43 | 0.9561 | 94.92 | 92.96 | 0.9435 | | 10 | 85.05 | 85.19 | 0.8304 | 96.69 | 95.94 | 0.9595 | 92.44 | 87.65 | 0.9157 | | 12 | 83.74 | 85.14 | 0.8156 | 95.96 | 93.41 | 0.9462 | 93.14 | 89.12 | 0.9236 |
|
Table 10. Classification results of S2AF-GCN on different datasets under different aggregation times