
Huiling Huang, Chengcheng Chang, Jun Han. Speckle-Field Focusing Based on Estimation of Distribution Algorithm[J]. Laser & Optoelectronics Progress, 2024, 61(18): 1829001
- Laser & Optoelectronics Progress
- Vol. 61, Issue 18, 1829001 (2024)
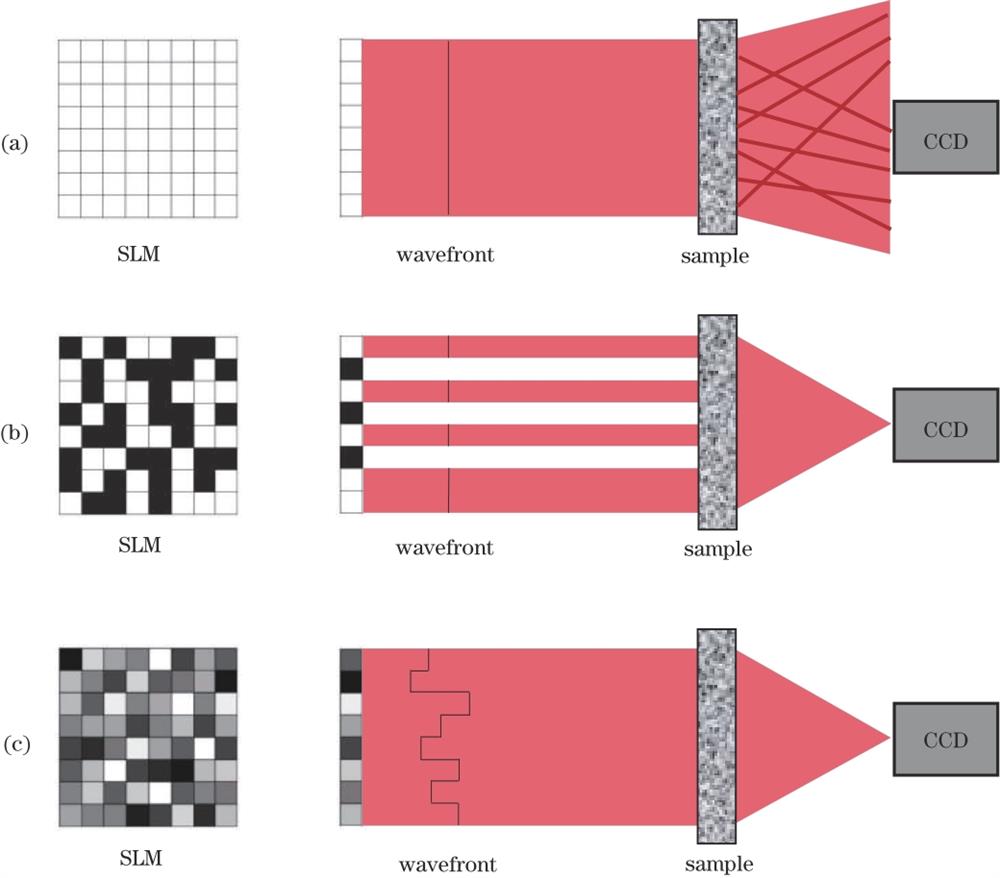
Fig. 1. Schematic diagram of focusing. (a) Speckles formed as a result of plane waves through a strong scattering medium; (b) a focused spot is formed after amplitude modulation; (c) a focused spot is formed after phase modulation

Fig. 2. Simulation model used for focusing of speckle field
Fig. 3. Processing flow chart of estimation of distribution algorithm
Fig. 4. Results diagram of focusing by amplitude modulation. (a) Random speckle pattern formed from unmodulated incident light; (b) a focusing spot formed by amplitude modulation; (c) relationship between enhancement factor and iterations; (d) amplitude pattern of a focusing spot in (b) formed by loading on SLM
Fig. 5. Single and multiple focusing spots image at the defined target after amplitude modulation. (a) Single spot focusing diagram; (b) two-spot focusing diagram; (c) three-spot focusing diagram
Fig. 6. Results diagram of focusing by phase modulation. (a) Random speckle pattern formed from unmodulated incident light; (b) a focusing spot formed from by phase modulation; (c) change curve of light intensity growth factor with number of iteration at target position; (d) phase pattern of a focusing spot in (b) formed by loading on SLM
Fig. 7. Single and multiple focusing spots image at defined target after phase modulation. (a) Single spot focusing diagram; (b) two-spot focusing diagram; (c) three-spot focusing diagram
Fig. 8. Relationship diagram between light intensity enhancement factor, elapsed time and total number of modulation units
Fig. 9. Relationship diagram between light intensity enhancement factor, elapsed time and number of iteration under phase modulation
Fig. 10. Relationship between enhancement factor of light intensity at target position after phase modulation and noise under different noise levels and algorithms


Set citation alerts for the article
Please enter your email address

© Copyright 2018-2021 | Chinese Laser Press. All Rights Reserved 沪ICP备15018463号-20