• Laser & Optoelectronics Progress
  • Vol. 62, Issue 5, 0512005 (2025)
Haiying Shao1,*, Zengliang Zhang2, Xiaohan Ma1, Yanfeng Li1..., Yuhang Fu1 and Jiabin Ma1|Show fewer author(s)
Author Affiliations
  • 1School of Electronic and Control Engineering, North China Institute of Aerospace Engineering, Langfang 065000, Hebei , China
  • 2School of Electronic and Information Engineering, Langfang Normal University, Langfang 065000, Hebei , China
  • show less
    DOI: 10.3788/LOP241681 Cite this Article Set citation alerts
    Haiying Shao, Zengliang Zhang, Xiaohan Ma, Yanfeng Li, Yuhang Fu, Jiabin Ma. Design and Application of Dual-Band Specific Color Temperature Measuring Device[J]. Laser & Optoelectronics Progress, 2025, 62(5): 0512005 Copy Citation Text show less
    Colorimetric temperature measuring device schematic diagram
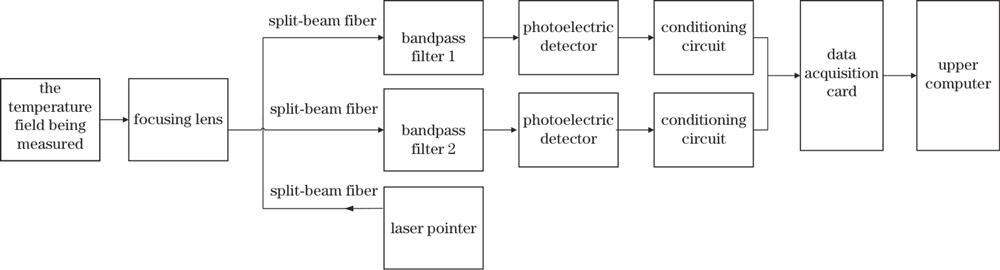
    Fig. 1. Colorimetric temperature measuring device schematic diagram
    The relationship curves of wavelength and blackbody radiation emission degree at different temperatures
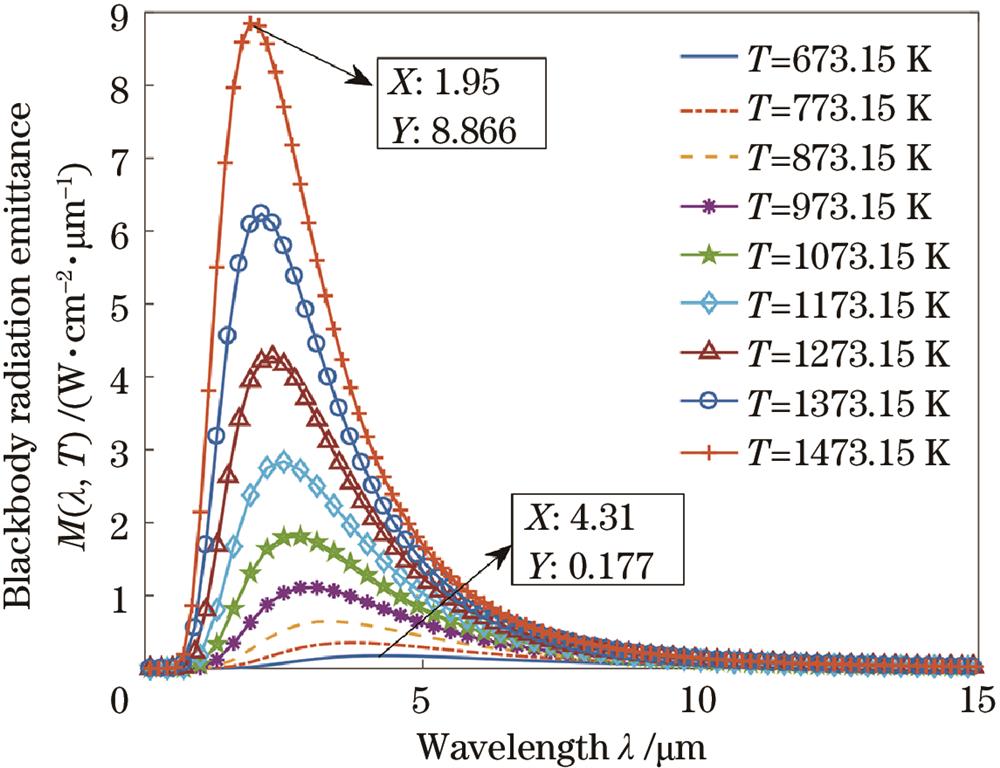
    Fig. 2. The relationship curves of wavelength and blackbody radiation emission degree at different temperatures
    The ratio curves of temperature and radiation power at different wavelengths
    Fig. 3. The ratio curves of temperature and radiation power at different wavelengths
    The relation curves between temperature and sensitivity at different wavelengths
    Fig. 4. The relation curves between temperature and sensitivity at different wavelengths
    The ratio curves of temperature and radiation power at different wavelength intervals
    Fig. 5. The ratio curves of temperature and radiation power at different wavelength intervals
    The relation curves between temperature and sensitivity at different wavelength intervals
    Fig. 6. The relation curves between temperature and sensitivity at different wavelength intervals
    The ratio curve of temperature and radiation power at different bandwidths
    Fig. 7. The ratio curve of temperature and radiation power at different bandwidths
    Schematic diagram of photodetector circuit
    Fig. 8. Schematic diagram of photodetector circuit
    Schematic diagram of the photodetector conditioning circuit
    Fig. 9. Schematic diagram of the photodetector conditioning circuit
    Static calibration experiment of colorimetric temperature measuring device
    Fig. 10. Static calibration experiment of colorimetric temperature measuring device
    Curve results of polynomial fitting method
    Fig. 11. Curve results of polynomial fitting method
    Colorimetric temperature measuring device
    Fig. 12. Colorimetric temperature measuring device
    Three groups of experimental relationship graph. (a) (c) (e) Temperature and time curves measured by the two devices in the three experiments respectively; (b) (d) (f) relative error curves of the temperature measured by the two devices in the three experiments respectively
    Fig. 13. Three groups of experimental relationship graph. (a) (c) (e) Temperature and time curves measured by the two devices in the three experiments respectively; (b) (d) (f) relative error curves of the temperature measured by the two devices in the three experiments respectively
    Temperature /℃CH1 /mVCH2 /mVRT
    4004.58412.1082.641
    50020.40145.1712.214
    60064.423126.3111.961
    700165.493289.7811.751
    800355.704561.3241.578
    900687.850989.8851.439
    10001221.5181604.9831.314
    11001923.8542346.9211.220
    12003060.7233662.2551.197
    Table 1. The two voltage values and their ratios output by the colorimetric temperature measurement device
    Haiying Shao, Zengliang Zhang, Xiaohan Ma, Yanfeng Li, Yuhang Fu, Jiabin Ma. Design and Application of Dual-Band Specific Color Temperature Measuring Device[J]. Laser & Optoelectronics Progress, 2025, 62(5): 0512005
    Download Citation