• Laser & Optoelectronics Progress
  • Vol. 60, Issue 16, 1611003 (2023)
Jiyang Yao, Xiaozhao Zheng, Huajun Li*, and Shanen Yu
Author Affiliations
  • School of Automation, Hangzhou Dianzi University, Hangzhou 310016, Zhejiang, China
  • show less
    DOI: 10.3788/LOP222331 Cite this Article Set citation alerts
    Jiyang Yao, Xiaozhao Zheng, Huajun Li, Shanen Yu. Research on Optical Tomography Based on Optimized Landweber Algorithm[J]. Laser & Optoelectronics Progress, 2023, 60(16): 1611003 Copy Citation Text show less
    Schematic diagram of objects scanned by light emitter
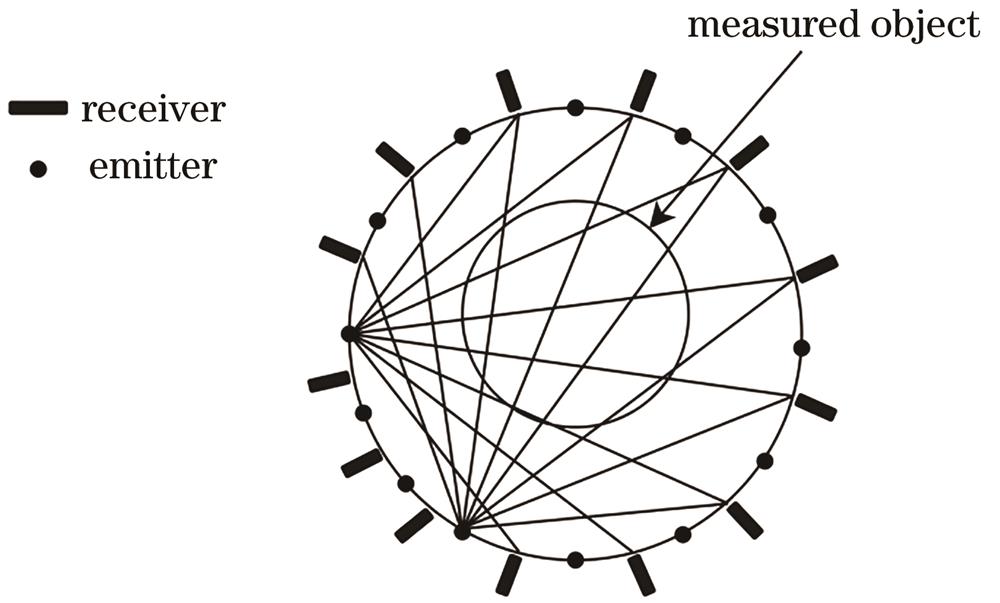
    Fig. 1. Schematic diagram of objects scanned by light emitter
    Schematic diagram of one ray projection
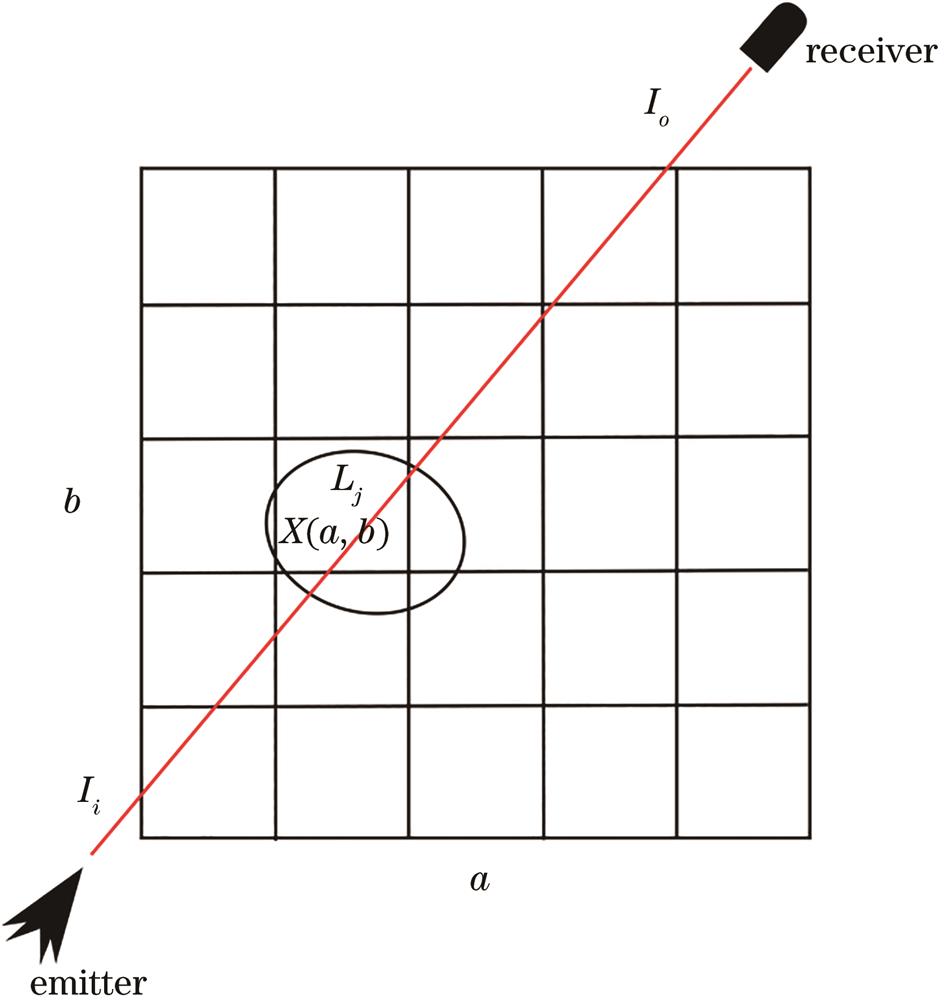
    Fig. 2. Schematic diagram of one ray projection
    Schematic diagram of 25×25 sensor array.(a) Light distribution diagram; (b) diagram of sensitive field
    Fig. 3. Schematic diagram of 25×25 sensor array.(a) Light distribution diagram; (b) diagram of sensitive field
    Schematic diagrams of five section distribution scenarios.(a) 15 radius circle with 'hard edge'; (b) 20 radius circle with 'hard edge';(c) Gauss circle of radius 10 with 'soft edge'; (d) 10 and 20 radius circles with 'hard edge'; (e) 15 and 20 radius circles with 'hard edge'
    Fig. 4. Schematic diagrams of five section distribution scenarios.(a) 15 radius circle with 'hard edge'; (b) 20 radius circle with 'hard edge';(c) Gauss circle of radius 10 with 'soft edge'; (d) 10 and 20 radius circles with 'hard edge'; (e) 15 and 20 radius circles with 'hard edge'
    Comparison curve of iteration times and relative error of different algorithms. (a) Scene 1; (b) scene 2; (c) scene 3; (d) scene 4; (e) scene 5
    Fig. 5. Comparison curve of iteration times and relative error of different algorithms. (a) Scene 1; (b) scene 2; (c) scene 3; (d) scene 4; (e) scene 5
    Comparison of images reconstructed by different algorithms in different scenes
    Fig. 6. Comparison of images reconstructed by different algorithms in different scenes
    SceneLWLWPLWAP
    1000 iterations4000 iterations1000 iterations4000 iterations1000 iterations4000 iterations
    10.09440.03370.01243.236E-040.00146.925E-05
    20.11110.08000.06130.03600.04440.0169
    30.15080.12120.10350.08420.09050.0704
    40.11600.09150.08560.06440.07250.0466
    50.13370.10820.09260.07520.08130.0628
    Table 1. Relative error comparison of 1000 iterations and 4000 iterations
    Scene

    Relative error

    δ

    LWLWPLWAP
    Number of iterationsTime /sNumber of iterationsTime /sNumber of iterationsTime /s
    10.04145305311.402503.421001.60
    20.0919724617.152633.891001.64
    30.1293027829.402683.801001.46
    40.1028018646.912603.491001.38
    50.1217019416.482212.961001.39
    Table 2. Analysis of iteration times and iteration time required for same relative error
    SceneTIKLWLWPLWAP
    δβδβδβδβ
    10.39990.90350.03590.99910.00611.00000.00241.0000
    20.35320.92060.07390.99630.04510.99830.02170.9995
    30.45930.95060.14650.97970.10120.98960.08960.9919
    40.34950.91050.08950.99440.06500.99760.05050.9986
    50.40600.91560.09540.99110.07320.99630.06360.9974
    Table 3. Comparison of reconstructed image data by reconstruction algorithm
    SceneLWLWPLWAP
    Iteration timesTime /sIteration timesTime /sIteration timesTime /s
    1369325.98147535.9684020.37
    2509528.98245654.71313456.01
    312663.75115415.36106915.83
    4470013.76386758.29327153.03
    5794522.76485173.91379456.71
    Table 4. Comparison of iteration times and time between LW algorithm and two improved algorithms
    Jiyang Yao, Xiaozhao Zheng, Huajun Li, Shanen Yu. Research on Optical Tomography Based on Optimized Landweber Algorithm[J]. Laser & Optoelectronics Progress, 2023, 60(16): 1611003
    Download Citation