• Laser & Optoelectronics Progress
  • Vol. 60, Issue 17, 1730003 (2023)
Jinfu Zhang1,2,3, Bin Tang1,2,3, Jianxu Wang1,2,3,*, Yanfei Chuan1,2,3..., Zourong Long1,2,3, Qing Chen1,2,3, Junfeng Miao1,2,3, Linfeng Cai1,2,3, Mingfu Zhao1,2,3 and Mi Zhou2|Show fewer author(s)
Author Affiliations
  • 1Chongqing Key Laboratory of Optical Fiber Sensing and Photoelectric Detection, Chongqing 400054, China
  • 2Intelligent Optical Fiber Perception Technology, Chongqing University Engineering Research Center, Chongqing 400054, China
  • 3School of Electrical and Electronic Engineering, Chongqing University of Technology, Chongqing 400054, China
  • show less
    DOI: 10.3788/LOP221956 Cite this Article Set citation alerts
    Jinfu Zhang, Bin Tang, Jianxu Wang, Yanfei Chuan, Zourong Long, Qing Chen, Junfeng Miao, Linfeng Cai, Mingfu Zhao, Mi Zhou. Comparative Analysis of Characteristic Wavelength Screening of Apple Soluble Solids Based on Near-Infrared Spectroscopy[J]. Laser & Optoelectronics Progress, 2023, 60(17): 1730003 Copy Citation Text show less
    Schematic diagram of the spectrum acquisition platform
    Fig. 1. Schematic diagram of the spectrum acquisition platform
    Original spectra of 120 samples
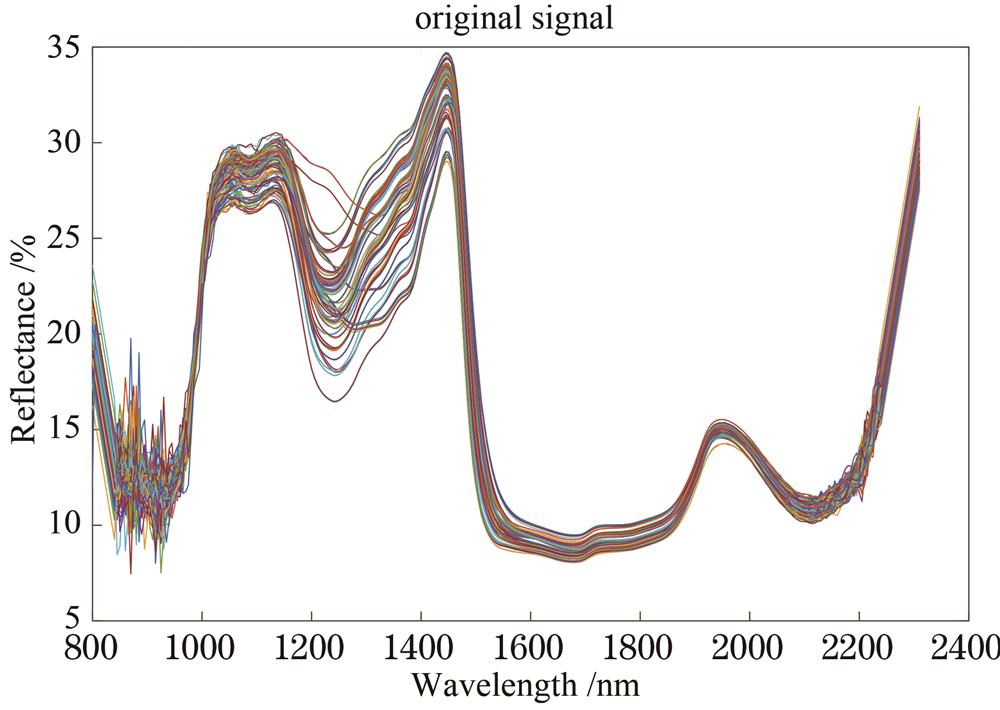
    Fig. 2. Original spectra of 120 samples
    Comparison of original and preprocessed spectra
    Fig. 3. Comparison of original and preprocessed spectra
    Flow chart of PLS modeling based on mutual information
    Fig. 4. Flow chart of PLS modeling based on mutual information
    Relationship between number of PLS principal components and training sets R2 and MSE
    Fig. 5. Relationship between number of PLS principal components and training sets R2 and MSE
    Full spectrum PLS analysis results
    Fig. 6. Full spectrum PLS analysis results
    Screening results of key variables based on CARS. (a) Reserved variables per run; (b) RMSECV of PLS model based on cars; (c) change of variable regression coefficient during each operation, and the asterisk indicates the lowest RMSECV
    Fig. 7. Screening results of key variables based on CARS. (a) Reserved variables per run; (b) RMSECV of PLS model based on cars; (c) change of variable regression coefficient during each operation, and the asterisk indicates the lowest RMSECV
    Analysis of CARS-PLS results
    Fig. 8. Analysis of CARS-PLS results
    Analysis of MI-PLS results
    Fig. 9. Analysis of MI-PLS results
    Selected variables
    Fig. 10. Selected variables
    Data setNumber of samplesMin /%Max /%Mean /%Standard deviation /%
    Calibration set968.7814.6211.200.92
    Prediction set248.9213.5311.180.92
    Overall1208.7814.6211.190.91
    Table 1. Statistics of SSC of 120 samples in the data sets
    Modeling methodNumber of wavelengthsLVsR2RMSECRMSEP
    Full band -PLS303160.85110.94131.1915
    CARS-PLS12100.87460.86400.9757
    MI-PLS56150.92180.68220.8235
    Table 2. SSC prediction results of apple by PLS models using the variables obtained by different variable selection algorithms
    Jinfu Zhang, Bin Tang, Jianxu Wang, Yanfei Chuan, Zourong Long, Qing Chen, Junfeng Miao, Linfeng Cai, Mingfu Zhao, Mi Zhou. Comparative Analysis of Characteristic Wavelength Screening of Apple Soluble Solids Based on Near-Infrared Spectroscopy[J]. Laser & Optoelectronics Progress, 2023, 60(17): 1730003
    Download Citation