• Laser & Optoelectronics Progress
  • Vol. 60, Issue 15, 1528002 (2023)
Bing Xu1,2,*, Yan Li1,2, Zhihui Luo1,2, and Jianglou Huang1,2
Author Affiliations
  • 1College of Science, China Three Gorges University, Yichang 443002, Hubei, China
  • 2Hubei Engineering Research Center of Weak Magnetic-Filed Detection, Yichang 443002, Hubei, China
  • show less
    DOI: 10.3788/LOP223419 Cite this Article Set citation alerts
    Bing Xu, Yan Li, Zhihui Luo, Jianglou Huang. A Novel Colorimetric Glucose Biosensor Based on Graphene Oxide-Gold Nanoparticles-Glucose Oxidase Composites[J]. Laser & Optoelectronics Progress, 2023, 60(15): 1528002 Copy Citation Text show less
    Preparation principle of GO-AuNPs-GOD complex
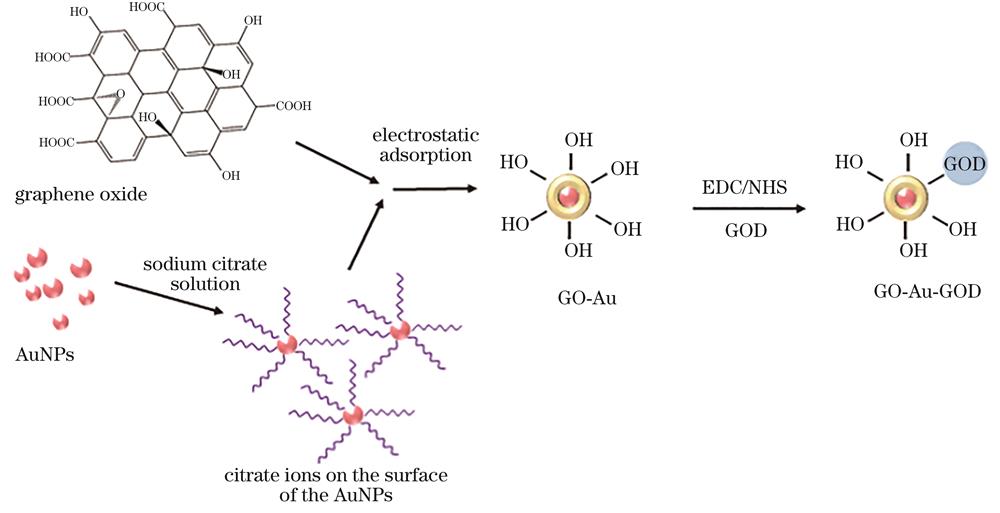
    Fig. 1. Preparation principle of GO-AuNPs-GOD complex
    Principle of the colorimetric method for glucose solution detection
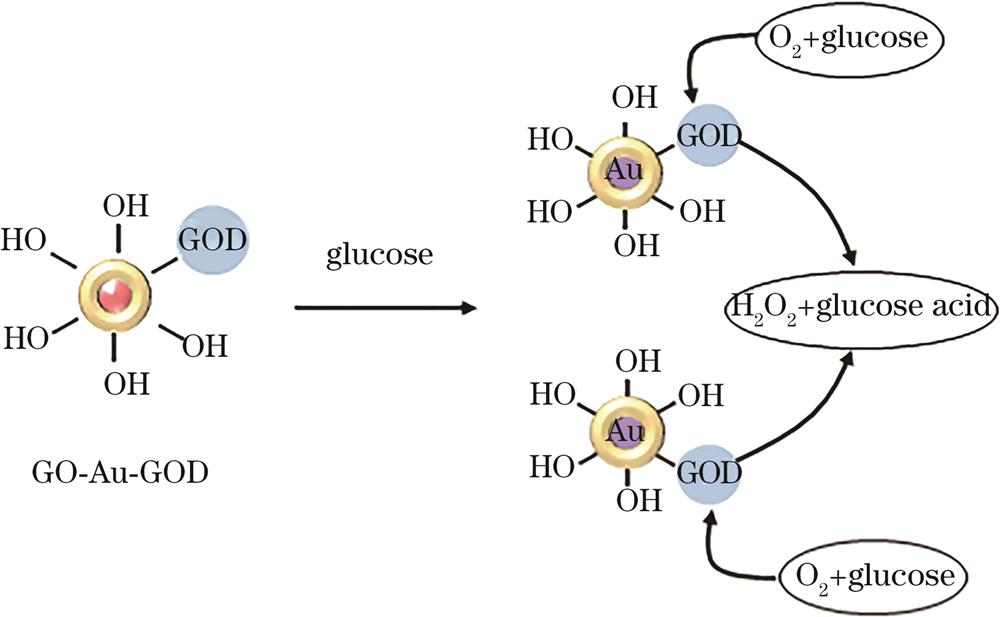
    Fig. 2. Principle of the colorimetric method for glucose solution detection
    Characterization of GO-AuNPs composite nanoparticles. (a) UV absorption spectra; (b)(c) TEM image
    Fig. 3. Characterization of GO-AuNPs composite nanoparticles. (a) UV absorption spectra; (b)(c) TEM image
    Survival rate of cells cultured with different mass concentrations of GO-AuNPs composite nanoparticles for different periods
    Fig. 4. Survival rate of cells cultured with different mass concentrations of GO-AuNPs composite nanoparticles for different periods
    Characterization of GO-AuNPs-GOD composites nanoparticles. (a) UV absorption spectra; (b) Raman spectra
    Fig. 5. Characterization of GO-AuNPs-GOD composites nanoparticles. (a) UV absorption spectra; (b) Raman spectra
    Zeta potential test diagram of complex
    Fig. 6. Zeta potential test diagram of complex
    Effect of particle size on sensor
    Fig. 7. Effect of particle size on sensor
    Effect of Au /GO volume ratio on sensor performance
    Fig. 8. Effect of Au /GO volume ratio on sensor performance
    Effect of GOD mass concentration on sensor performance
    Fig. 9. Effect of GOD mass concentration on sensor performance
    Effect of pH on sensor performance
    Fig. 10. Effect of pH on sensor performance
    Sensitivity of the sensor. (a) Absorption spectra at different glucose mass concentrations; (b) relationship between the change of absorption wavelength and glucose mass concentration
    Fig. 11. Sensitivity of the sensor. (a) Absorption spectra at different glucose mass concentrations; (b) relationship between the change of absorption wavelength and glucose mass concentration
    Selectivity of sensor
    Fig. 12. Selectivity of sensor
    MaterialMechanismLinear rangeSensitivityReference
    GO-AuNPs-GODColorimetric0-1.6 mg/mL14.4 nm/(mg/mL)This work
    Ag@AuTNPsColorimetric0-30 mmol·L-10.00325 A800/mmol·L-134
    GO-AuNPs-GOD-FiberSPR0-11 mmol·L-11.06 nm/mmol·L-135
    Table 1. Compared with similar sensors
    Sample No.Mass concentration of added glucose /(mg·mL-1Mass concentration of detected glucose /(mg·mL-1aRecovery /%
    10.500.51102.00
    20.900.8998.89
    31.301.2495.38
    Table 2. Detection of glucose in SBF
    Bing Xu, Yan Li, Zhihui Luo, Jianglou Huang. A Novel Colorimetric Glucose Biosensor Based on Graphene Oxide-Gold Nanoparticles-Glucose Oxidase Composites[J]. Laser & Optoelectronics Progress, 2023, 60(15): 1528002
    Download Citation