
Linjun Li, Zhantao Lu, Xinglong Xie, Meizhi Sun, Xiao Liang, Qingwei Yang, Ailin Guo, Ping Zhu, Xuejie Zhang, Dongjun Zhang, Hao Xue, Guoli Zhang, Rashid Ul Haq, Haidong Zhu, Jun Kang, Jianqiang Zhu, "Ultrafast characterization of plasma critical surface evolution in inertial confinement fusion experiments with chirped laser pulses," High Power Laser Sci. Eng. 13, 02000e13 (2025)
- High Power Laser Science and Engineering
- Vol. 13, Issue 2, 02000e13 (2025)
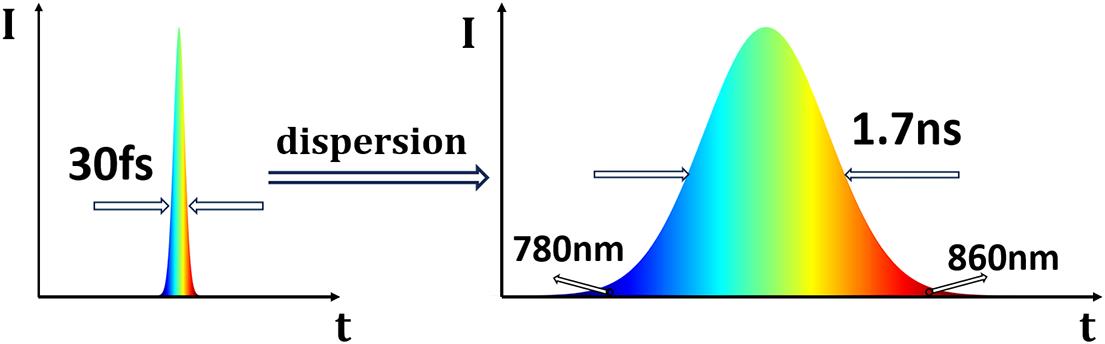
Fig. 1. A femtosecond laser pulse with a center wavelength of 808 nm and a pulse duration of 30 fs is coupled into a pulse stretcher. The pulse stretcher introduces group velocity dispersion, which stretches temporally the pulse duration by frequency–time chirp. This results in the generation of a chirped probe pulse with a duration of 1.7 ns and a spectral range of 780–860 nm. The time-dependent wavelength distribution of this stretched probe pulse allows for time-resolved probing of the evolving plasma dynamics under investigation.
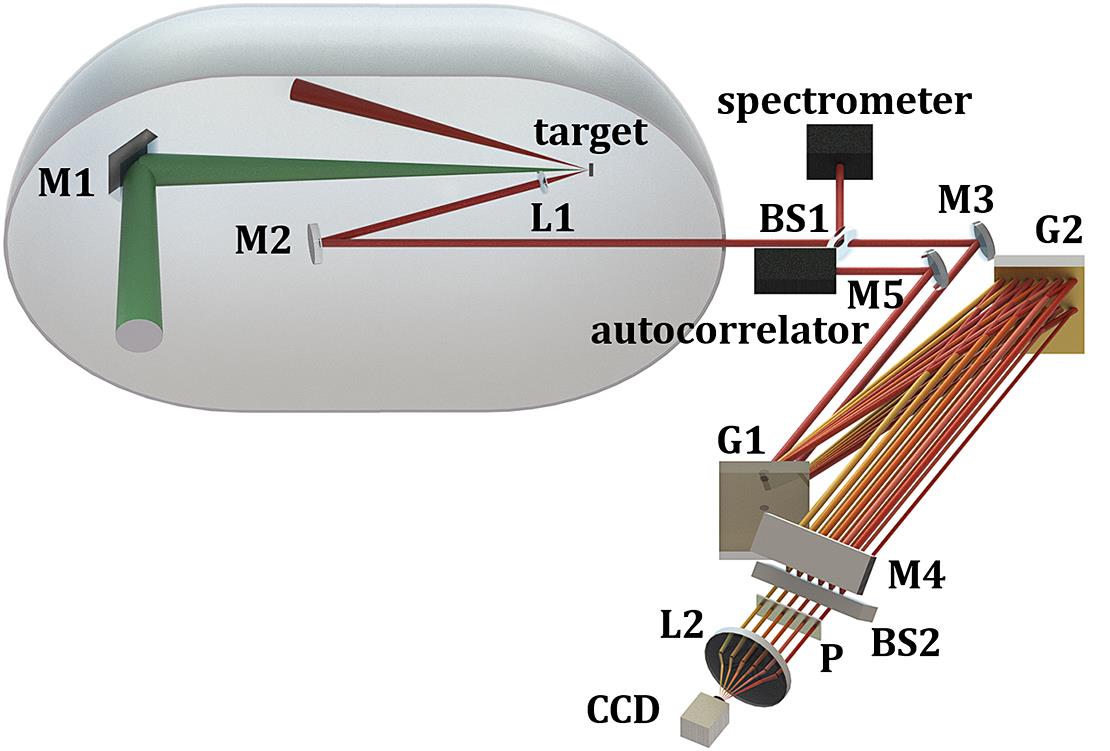
Fig. 2. The experimental setup consists of the following optical components: M1–M7 are reflective mirrors, BS1 and BS2 are beam splitters, L1 and L2 are focusing lenses, G1 and G2 are gold-coated diffraction gratings and P is an aperture plate. Notably, M1, M2 and the target are all situated within a vacuum target chamber.
Fig. 3. The initial conditions for the simulation.
Fig. 4. Measured probe beam spectrum (red line) and calculated spectrum (blue line). Without considering the change in the critical surface morphology, the probe beam is delayed relative to the drive beam by (a) 250 ps, (c) 940 ps and (e) 1035 ps. Considering the change in the critical surface morphology, the probe beam is delayed relative to the drive beam by (b) 250 ps, (d) 940 ps and (f) 1035 ps.
Fig. 5. The image on the CCD sensor (a) without the driving laser and (b) with the driving laser. Specifically, the zero-point in the figure represents the moment when the probe beam begins to interact with the target.
Fig. 6. (a) Autocorrelation signals at different time delays (0, 200, 400, 600, 800 ps). (b) Critical surface expansion velocity measured from the autocorrelation signals (red line) and obtained from numerical simulations (blue line). (c) Critical surface position as a function of time measured from the autocorrelation signals (red line) and obtained from numerical simulations (blue line). (The negative sign in Figures 6(b) and 6(c) indicates that the direction of the plasma critical surface movement is opposite to the direction of the drive laser.)


Set citation alerts for the article
Please enter your email address

© Copyright 2018-2021 | Chinese Laser Press. All Rights Reserved 沪ICP备15018463号-20