• Chinese Optics Letters
  • Vol. 21, Issue 10, 101203 (2023)
Jiahui Zhang1,2, Feng Xu1,2, Ran An1,2, Lin Wang1,2..., Min Jiang3, Guanghui Wang1,2,* and Yanqing Lu1,**|Show fewer author(s)
Author Affiliations
  • 1College of Engineering and Applied Sciences, Nanjing University, Nanjing 210093, China
  • 2Key Laboratory of Intelligent Optical Sensing and Integration of the Ministry of Education, Nanjing University, Nanjing 210009, China
  • 3College of Science, Wuxi University, Wuxi 214411, China
  • show less
    DOI: 10.3788/COL202321.101203 Cite this Article Set citation alerts
    Jiahui Zhang, Feng Xu, Ran An, Lin Wang, Min Jiang, Guanghui Wang, Yanqing Lu, "Integrated fluorescence excitation, collection, and filtering on a GaN waveguide chip," Chin. Opt. Lett. 21, 101203 (2023) Copy Citation Text show less
    Concept of an integrated fluorescence detection chip for actual application case.
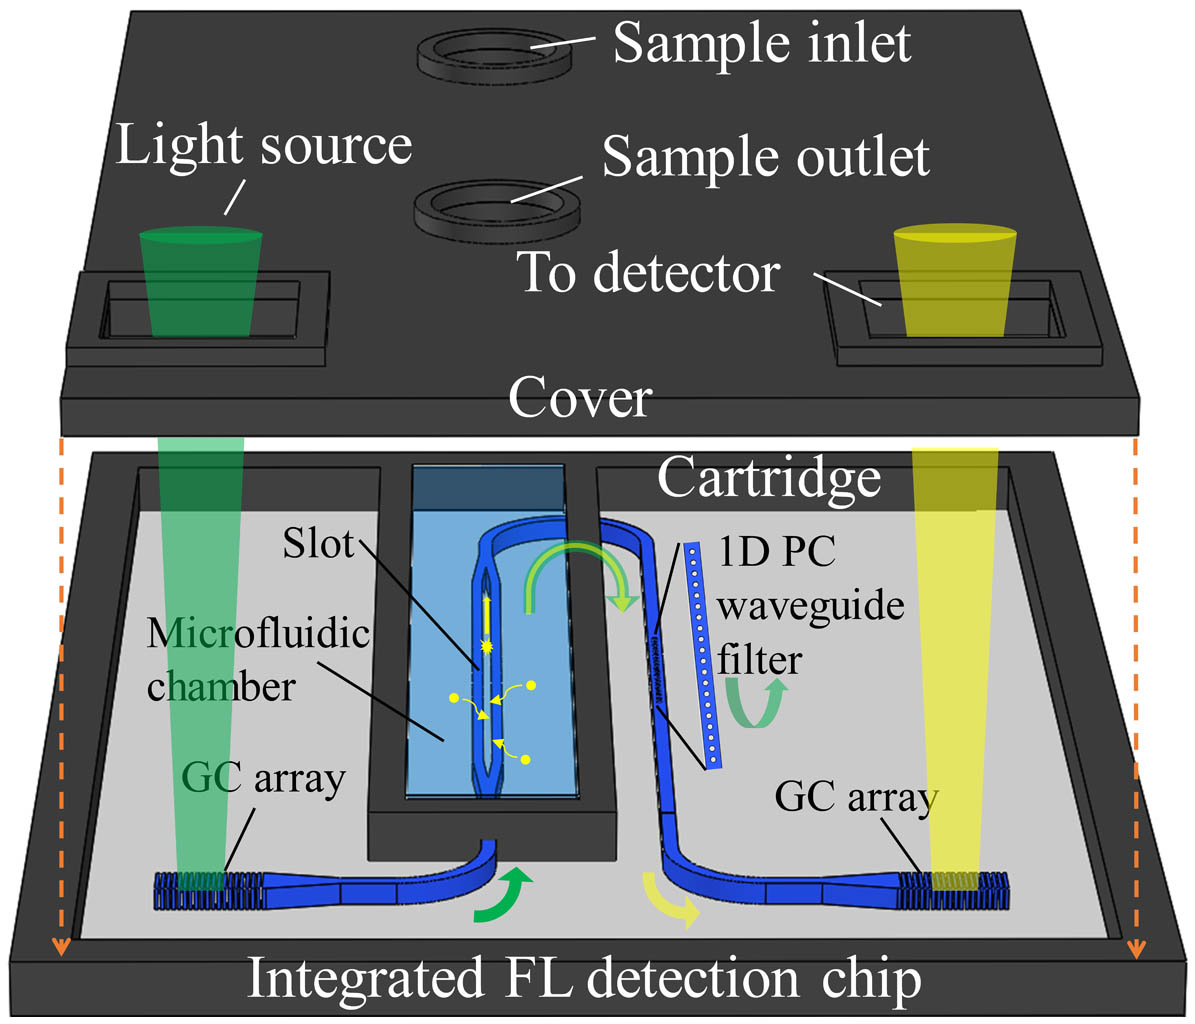
    Fig. 1. Concept of an integrated fluorescence detection chip for actual application case.
    (a) Schematic diagram of the fluorescence excitation and collection system. Detailed structure of (b) slot waveguide and (c) stripe waveguide; (d) top view of part of the slot waveguide and Y-split waveguide; (e) detailed structure diagram of 1D PC waveguide.
    Fig. 2. (a) Schematic diagram of the fluorescence excitation and collection system. Detailed structure of (b) slot waveguide and (c) stripe waveguide; (d) top view of part of the slot waveguide and Y-split waveguide; (e) detailed structure diagram of 1D PC waveguide.
    (a) Graph of the ratio of normalized power in slot versus Ws when W2 is 130 nm (black dot line), 140 nm (red triangular line), 150 nm (blue square line), 160 nm (green diamond line), and 170 nm (purple hexagonal line) under the wavelength of 520 nm; (b) relationship between propagation loss and W2; electrical field distributions of the slot waveguide with the wavelengths of (c) 520 nm and (d) 612 nm.
    Fig. 3. (a) Graph of the ratio of normalized power in slot versus Ws when W2 is 130 nm (black dot line), 140 nm (red triangular line), 150 nm (blue square line), 160 nm (green diamond line), and 170 nm (purple hexagonal line) under the wavelength of 520 nm; (b) relationship between propagation loss and W2; electrical field distributions of the slot waveguide with the wavelengths of (c) 520 nm and (d) 612 nm.
    Propagation of coupled mode in slot when the dipole is polarized in (a) x, (b) y, and (c) z directions.
    Fig. 4. Propagation of coupled mode in slot when the dipole is polarized in (a) x, (b) y, and (c) z directions.
    (a) Relationship between the efficiency of the slot-stripe converter and the wavelength when the included angle α is 5° (orange line), 10° (blue line), and 15° (green line), separately. The diamond and square marks represent exciting and fluorescent wavelengths. (b) Electrical field distributions of the Y-split waveguide with the wavelengths of (I) 520 nm and (II) 612 nm; (c) relationship between the efficiency of the slot-stripe converter and the wavelength under ideal conditions (blue line) and with the consideration of fabrication accuracy (red line) when the included angle α of the Y-split waveguide is 10°; (d) electrical field distributions of the Y-split waveguide with fabrication accuracy for the wavelength of (I) 520 nm and (II) 612 nm.
    Fig. 5. (a) Relationship between the efficiency of the slot-stripe converter and the wavelength when the included angle α is 5° (orange line), 10° (blue line), and 15° (green line), separately. The diamond and square marks represent exciting and fluorescent wavelengths. (b) Electrical field distributions of the Y-split waveguide with the wavelengths of (I) 520 nm and (II) 612 nm; (c) relationship between the efficiency of the slot-stripe converter and the wavelength under ideal conditions (blue line) and with the consideration of fabrication accuracy (red line) when the included angle α of the Y-split waveguide is 10°; (d) electrical field distributions of the Y-split waveguide with fabrication accuracy for the wavelength of (I) 520 nm and (II) 612 nm.
    (a) Function of transmittance (green line) and reflectivity (orange line) with different wavelengths; the orange and green dashed lines represent exciting and fluorescent wavelengths, respectively. Electric field distributions of (b) excitation light and (c) fluorescence with OGFCS.
    Fig. 6. (a) Function of transmittance (green line) and reflectivity (orange line) with different wavelengths; the orange and green dashed lines represent exciting and fluorescent wavelengths, respectively. Electric field distributions of (b) excitation light and (c) fluorescence with OGFCS.
    Fig. 4Polarization DirectionηpWη
    (a)x-polarization48.52%0.885642.96%
    (b)y-polarization4.346%0.22900.9951%
    (c)z-polarization14.30%0.00017240.002465%
    Table 1. Coupling Efficiency of Fluorescence
    Jiahui Zhang, Feng Xu, Ran An, Lin Wang, Min Jiang, Guanghui Wang, Yanqing Lu, "Integrated fluorescence excitation, collection, and filtering on a GaN waveguide chip," Chin. Opt. Lett. 21, 101203 (2023)
    Download Citation