• Acta Photonica Sinica
  • Vol. 52, Issue 6, 0629001 (2023)
Yuexin LIU, Wei LIU*, Hongyan JIA, Jizhou CHEN..., Yajin WANG and Jin SHEN|Show fewer author(s)
Author Affiliations
  • School of Electrical Engineering, Shandong University of Technology, Zibo 255049, China
  • show less
    DOI: 10.3788/gzxb20235206.0629001 Cite this Article
    Yuexin LIU, Wei LIU, Hongyan JIA, Jizhou CHEN, Yajin WANG, Jin SHEN. Optimal Selection of Correlation Function Fitting Window in Bimodal Particle Size Inversion by Dynamic Light Scattering[J]. Acta Photonica Sinica, 2023, 52(6): 0629001 Copy Citation Text show less
    Example of sequential extraction of late exponentials method corresponding to bimodal particle systems
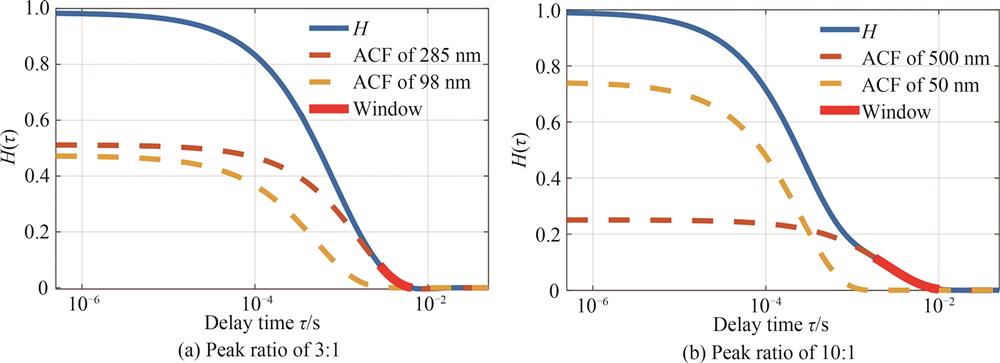
    Fig. 1. Example of sequential extraction of late exponentials method corresponding to bimodal particle systems
    Attenuation characteristics of the correlation function derived from the electric field correlation function Η(τ)
    Fig. 2. Attenuation characteristics of the correlation function derived from the electric field correlation function Η(τ)
    Electric field correlation function and attenuation rate of correlation function for 140.9 nm equivalent mean particle size
    Fig. 3. Electric field correlation function and attenuation rate of correlation function for 140.9 nm equivalent mean particle size
    Electric field correlation function and attenuation rate of correlation function for 70.6 nm equivalent mean particle size
    Fig. 4. Electric field correlation function and attenuation rate of correlation function for 70.6 nm equivalent mean particle size
    Bimodal particle correlation function relative attenuation characteristics plots
    Fig. 5. Bimodal particle correlation function relative attenuation characteristics plots
    Extraction results of 95 nm/285 nm bimodal correlation function by SELE method under the first fitting window
    Fig. 6. Extraction results of 95 nm/285 nm bimodal correlation function by SELE method under the first fitting window
    Extraction results of 95 nm/285 nm bimodal particle correlation function by SELE method under the second fitting window
    Fig. 7. Extraction results of 95 nm/285 nm bimodal particle correlation function by SELE method under the second fitting window
    H-RAC plots and reference points of bimodal particles for different equivalent mean particle sizes
    Fig. 8. H-RAC plots and reference points of bimodal particles for different equivalent mean particle sizes
    Extraction results of 95 nm/285 nm bimodal correlation function by ACSELE method
    Fig. 9. Extraction results of 95 nm/285 nm bimodal correlation function by ACSELE method
    Extraction results of 100 nm/400 nm bimodal correlation function by ACSELE method
    Fig. 10. Extraction results of 100 nm/400 nm bimodal correlation function by ACSELE method
    ACSELE method for 60 nm/220 nm measured bimodal particle correlation function extraction results
    Fig. 11. ACSELE method for 60 nm/220 nm measured bimodal particle correlation function extraction results
    ACSELE method for 65 nm/450 nm measured bimodal particle correlation function extraction results
    Fig. 12. ACSELE method for 65 nm/450 nm measured bimodal particle correlation function extraction results
    Dmean/nm

    Dmax/

    nm

    Dmin/

    nm

    D1/

    nm

    D2/

    nm

    Edd1/

    %

    Edd2/

    %

    Dpeak1/

    nm

    Dpeak2/

    nm

    Epp1/

    %

    Epp2/

    %

    VrmsWindow1Window2
    140.9285.095.0134.84.552.695.2187.33.534.296.30.1043.63×10-4:1.10×10-34.25×10-5:1.245×10⁻⁴
    159.178.544.117.3231.01000.018.995.20.1226.20×10-4:1.80×10-31.45×10-5:4.25×10⁻⁵
    250.885.411.910.0265.670.56.825.70.2771.10×10-3:5.30×10-34.25×10-5:3.63×10⁻⁴
    400.0100.0365.094.18.75.8376.475.65.824.30.3061.10×10-3:9.00×10-31.45×10-5:3.63×10⁻⁴
    465.8100.616.40.6464.181.116.018.80.3611.10×10-3:1.54×10-24.25×10-5:3.63×10⁻⁴
    404.999.11.20.8432.893.28.26.70.5241.80×10-3:9.00×10-31.245×10-4:6.20×10⁻⁶
    630.0105.0517.1101.717.93.0600.586.94.617.10.3491.80×10-3:9.00×10-31.45×10-5:3.63×10⁻⁴
    570.6108.59.43.3705.486.911.917.10.3803.10×10-3:9.00×10-34.25×10-5:3.63×10⁻⁴
    702.0111.411.46.1811.1100.028.74.70.5193.10×10-3:1.71×10-27.30×10-5:5.57×10⁻⁴
    70.6144.048.0156.552.08.78.4162.949.713.13.60.2221.10×10-3:3.10×10-31.45×10-5:3.63×10⁻⁴
    95.642.833.610.7114.932.720.131.70.2133.63×10-4:1.60×10-34.25×10-5:1.245×10⁻⁴
    137.946.64.22.9141.740.31.515.90.3546.20×10-4:3.10×10-34.25×10-5:2.125×10⁻⁴
    200.050.0180.350.59.81.0215.446.47.77.10.4591.10×10-3:3.10×10-31.45×10-5:3.63×10⁻⁴
    239.258.419.616.9247.753.323.86.70.6121.80×10-3:4.70×10-34.25×10-5:4.04×10⁻⁴
    221.254.010.68.0231.046.415.57.10.4581.10×10-3:5.30×10-37.30×10-5:2.125×10⁻⁴
    300.050.0235.445.921.58.0284.840.35.019.20.1301.10×10-3:3.10×10-31.45×10-5:2.125×10⁻⁴
    289.548.63.42.6327.446.49.17.10.0661.80×10-3:4.70×10-34.25×10-5:4.04×10⁻⁴
    272.146.99.26.1305.346.41.87.10.0591.10×10-3:5.30×10-34.25×10-5:3.63×10⁻⁴
    Table 1. Results of the simulated bimodal correlation function calculation using SELE method
    nmDmean/

    Dmax/

    nm

    Dmin/

    nm

    Ts/sTe/s

    Ys/

    (×10-3)

    Ye/

    (×10-3)

    Ym/

    (×10-3)

    Rs=Ys/YmRe=Ye/Ym
    140.9285.095.03.45×10-51.00×10-20.026 40.1728.8000.003 00.019
    400.0100.02.80×10-51.24×10-20.040 60.29611.9000.003 40.024
    630.0105.02.25×10-51.91×10-20.039 60.26012.3000.003 20.021
    70.6144.048.01.80×10-56.50×10-30.025 00.1427.6000.003 20.018
    200.050.02.25×10-56.50×10-30.033 60.25311.2000.003 00.022
    300.050.01.45×10-59.00×10-30.039 60.30012.4000.003 10.024
    Table 2. Calculation of start and end point of fitting window of simulated bimodal correlation function
    nmDmean/

    Dmax/

    nm

    Dmin/

    nm

    Ts/sTi/sTe/s

    D1/

    nm

    D2/

    nm

    Edd1/

    %

    Edd2/%

    Dpeak1/

    nm

    Dpeak2/

    nm

    Epp2/

    %

    Epp1/

    %

    Vrms
    140.9285.095.03.45×10-51.20×10-39.00×10-3285.695.00.22.5×10-2327.493.214.91.80.066
    400.0100.02.80×10-41.30×10-31.12×10-2403.798.60.91.3432.8100.08.20.00.531
    630.0105.02.25×10-51.50×10-31.91×10-2631.6104.10.20.8657.9107.24.40.20.056
    70.6144.048.01.80×10-56.20×10-45.30×10-3146.751.41.97.2162.949.713.13.60.043
    200.050.02.25×10-56.20×10-45.30×10-3198.949.10.51.6200.949.70.40.40.548
    300.050.01.45×10-57.68×10-48.10×10-3300.747.40.25.0305.349.71.80.40.043
    Table 3. Results of the simulated bimodal correlation function calculation using the ACSELE method
    nmDmax/

    Dmin/

    nm

    MethodTs/sTi/sTi1/sTe/s

    D1/

    nm

    D2/

    nm

    Edd1/

    %

    Edd2/

    %

    Dpeak1/

    nm

    Dpeak2/

    nm

    Epp1/

    %

    Epp2/

    %

    Vrms
    22060ACSELE7.65×10-58.29×10⁻⁴/3.60×10-3217.462.81.14.6215.456.42.05.90.110
    SELE4.45×10-52.85×10-41.00×10-33.60×10-3227.163.73.26.3213.350.33.016.11.023
    45065ACSELE5.65×10-51.00×10⁻³/3.10×10-345264.70.40.4442.662.41.64.20.011
    SELE2.85×10-53.81×10-47.01×10-43.30×10-3457.266.11.61.7422.959.96.07.70.735
    Table 4. Results of correlation function calculation for two groups of real bimodal particles using different methods
    Yuexin LIU, Wei LIU, Hongyan JIA, Jizhou CHEN, Yajin WANG, Jin SHEN. Optimal Selection of Correlation Function Fitting Window in Bimodal Particle Size Inversion by Dynamic Light Scattering[J]. Acta Photonica Sinica, 2023, 52(6): 0629001
    Download Citation