• Laser & Optoelectronics Progress
  • Vol. 60, Issue 2, 0211002 (2023)
Jing Kai1, Aiping Zhai1, Wenjing Zhao1, and Dong Wang1,2,*
Author Affiliations
  • 1College of Physics and Optoelectronics, Taiyuan University of Technology, Taiyuan 030024, Shanxi, China
  • 2Key Laboratory of Advanced Transducers and Intelligent Control Systems, Ministry of Education, Taiyuan University of Technology, Taiyuan 030024, Shanxi, China
  • show less
    DOI: 10.3788/LOP212877 Cite this Article Set citation alerts
    Jing Kai, Aiping Zhai, Wenjing Zhao, Dong Wang. Fourier Single-Pixel Imaging Based on Adaptive Down-Sampling in Frequency Domain[J]. Laser & Optoelectronics Progress, 2023, 60(2): 0211002 Copy Citation Text show less
    Fourier spectrum and energy distribution of "Cameraman" with resolution of 128 pixel×128 pixel. (a) Target image; (b) Fourier spectrum; (c) intensity distribution of single-pixel measurement
    Fig. 1. Fourier spectrum and energy distribution of "Cameraman" with resolution of 128 pixel×128 pixel. (a) Target image; (b) Fourier spectrum; (c) intensity distribution of single-pixel measurement
    Schematic diagram of sampling orders. (a) Conventional sequential sampling; (b) square sampling; (c) circular sampling
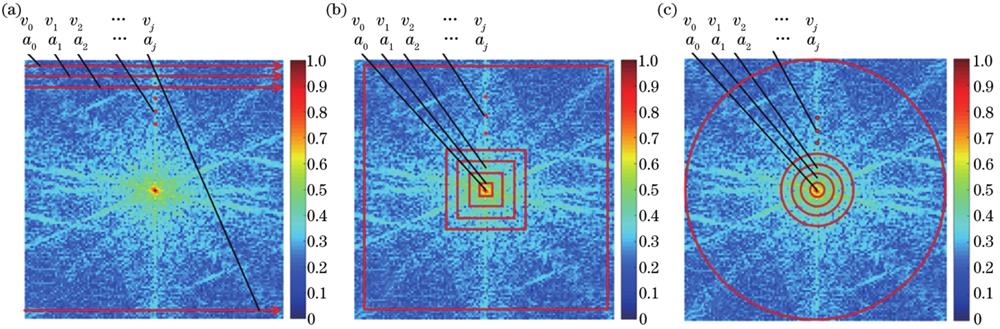
    Fig. 2. Schematic diagram of sampling orders. (a) Conventional sequential sampling; (b) square sampling; (c) circular sampling
    Mean value curve of measurement coefficient of each segment. (a) Using square sampling path; (b) using circular sampling path
    Fig. 3. Mean value curve of measurement coefficient of each segment. (a) Using square sampling path; (b) using circular sampling path
    Variance curve of measurement coefficient of each segment. (a) Using square sampling path; (b) using circular sampling path
    Fig. 4. Variance curve of measurement coefficient of each segment. (a) Using square sampling path; (b) using circular sampling path
    Logarithmic variance curve of measurement coefficients of each segment. (a) Using square sampling path; (b) using circular sampling path
    Fig. 5. Logarithmic variance curve of measurement coefficients of each segment. (a) Using square sampling path; (b) using circular sampling path
    Absolute value of slope of fitting curve. (a) Using square sampling path; (b) using circular sampling path
    Fig. 6. Absolute value of slope of fitting curve. (a) Using square sampling path; (b) using circular sampling path
    Imaging results and spectra of images “Orangutan”, “Cameraman”, and “Match” under adaptive square sampling, adaptive circular sampling, and sequential sampling
    Fig. 7. Imaging results and spectra of images “Orangutan”, “Cameraman”, and “Match” under adaptive square sampling, adaptive circular sampling, and sequential sampling
    Schematic diagram of experimental setup
    Fig. 8. Schematic diagram of experimental setup
    Adaptive sampling reconstruction results and spectra of different objects. (a) “USAF 1951” image; (b) “Turtle” model image; (c) “Three bars” image; (d) “One bar” image
    Fig. 9. Adaptive sampling reconstruction results and spectra of different objects. (a) “USAF 1951” image; (b) “Turtle” model image; (c) “Three bars” image; (d) “One bar” image
    Adaptive sampling reconstruction results and spectra of ‘Beetle’ model at daytime and nighttime
    Fig. 10. Adaptive sampling reconstruction results and spectra of ‘Beetle’ model at daytime and nighttime
    Target objectAdaptive square samplingAdaptive circular samplingSequential sampling
    PSNR /dBSSIMSR /%PSNR /dBSSIMSR /%PSNR /dBSSIMSR /%
    Orangutan23.900.78434.3323.370.74627.886.080.04627.00
    Cameraman23.420.82024.2222.700.80620.246.560.15320.24
    Match27.390.82923.4627.470.81618.467.990.03618.46
    Table 1. Simulation results of adaptive square sampling, adaptive circular sampling, and sequential sampling for images “Orangutan”,“Cameraman”, and “Match”
    ObjectAdaptive square samplingAdaptive circular sampling
    PSNR /dBSSIMSR /%PSNR /dBSSIMSR /%
    USAF195126.670.83249.4426.410.82338.92
    Turtle model30.480.84341.0430.560.83733.84
    Three bars31.050.90531.6431.050.90226.59
    One bar31.150.91524.7931.120.91320.98
    Table 2. Experimental results of adaptive square sampling and adaptive circular sampling for images of “USAF 1951”,“Turtle” model,“Three bars”, and “One bar”
    Imaging timeAdaptive square samplingAdaptive circular sampling
    PSNR /dBSSIMSR /%PSNR /dBSSIMSR /%
    Daytime28.780.82139.0628.490.81032.26
    Nighttime29.320.84437.1329.060.84330.67
    Table 3. Experimental results of adaptive square sampling and adaptive circular sampling for ‘Beetle’ model at daytime and nighttime
    Jing Kai, Aiping Zhai, Wenjing Zhao, Dong Wang. Fourier Single-Pixel Imaging Based on Adaptive Down-Sampling in Frequency Domain[J]. Laser & Optoelectronics Progress, 2023, 60(2): 0211002
    Download Citation