• Laser & Optoelectronics Progress
  • Vol. 62, Issue 3, 0306004 (2025)
Dapeng Wang* and Wei Dou
Author Affiliations
  • School of Civil Engineering, Suzhou University of Science and Technology, Suzhou 215011, Jiangsu , China
  • show less
    DOI: 10.3788/LOP241398 Cite this Article Set citation alerts
    Dapeng Wang, Wei Dou. Identification of Bolt Preload Loss Before and After Corrosion Based on Optical Frequency Domain Reflection Technique[J]. Laser & Optoelectronics Progress, 2025, 62(3): 0306004 Copy Citation Text show less
    OFDR basic principle diagram
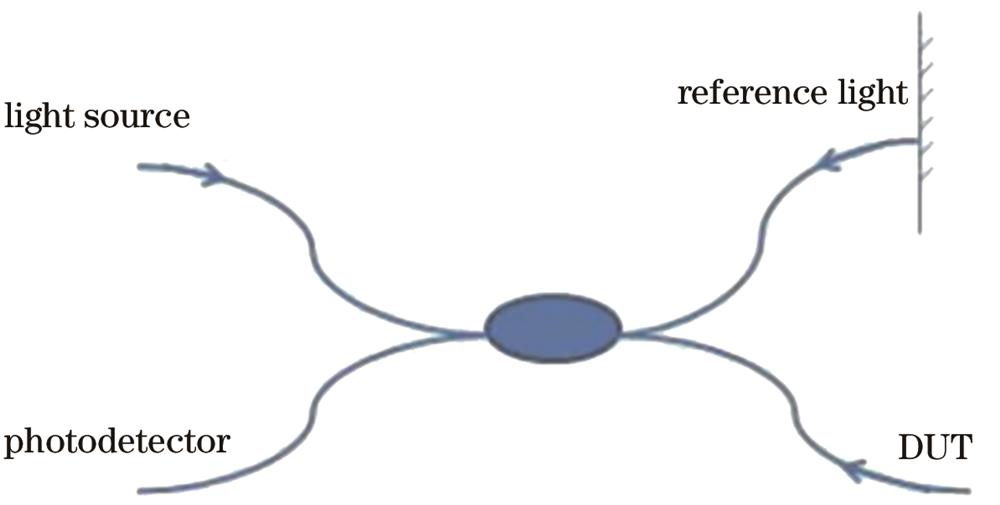
    Fig. 1. OFDR basic principle diagram
    Optical fiber paste placement diagram for equalstrength beams
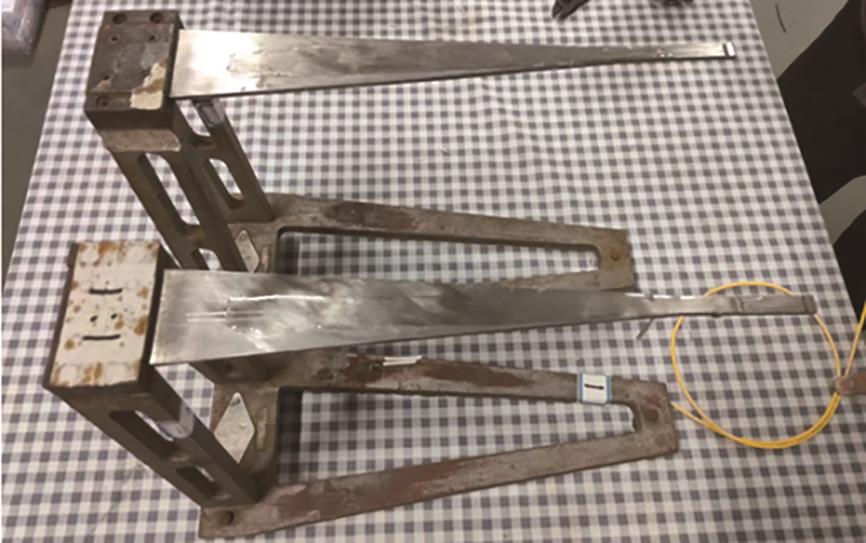
    Fig. 2. Optical fiber paste placement diagram for equalstrength beams
    Theoretical strain of equal-strength beams and optical fiber mean strain fitting curve
    Fig. 3. Theoretical strain of equal-strength beams and optical fiber mean strain fitting curve
    Theoretical strain of equal-strength beams under temperature stress and optical fiber mean strain fitting curve
    Fig. 4. Theoretical strain of equal-strength beams under temperature stress and optical fiber mean strain fitting curve
    Schematic diagrams of bolt numbering, cover dimensions, and physical fiber placement
    Fig. 5. Schematic diagrams of bolt numbering, cover dimensions, and physical fiber placement
    Comparison between before and after cleaning of corrosion products in group Ⅲ
    Fig. 6. Comparison between before and after cleaning of corrosion products in group Ⅲ
    Schematic diagrams of distributed fiber optic paste placement after corrosion in groups Ⅱ and Ⅲ
    Fig. 7. Schematic diagrams of distributed fiber optic paste placement after corrosion in groups Ⅱ and Ⅲ
    Strain distribution of unilateral 4-bolt specimens of group Ⅰ
    Fig. 8. Strain distribution of unilateral 4-bolt specimens of group Ⅰ
    Strain distribution of group Ⅰ unilateral 9-bolt specimens
    Fig. 9. Strain distribution of group Ⅰ unilateral 9-bolt specimens
    Group Ⅱ unilateral 4-bolt specimen loosening bolts 1-8
    Fig. 10. Group Ⅱ unilateral 4-bolt specimen loosening bolts 1-8
    Group Ⅰ unilateral 9-bolt specimen loosening bolts 1-9
    Fig. 11. Group Ⅰ unilateral 9-bolt specimen loosening bolts 1-9
    Strain distribution of graded release preload force of No. 1 bolt of group Ⅰ
    Fig. 12. Strain distribution of graded release preload force of No. 1 bolt of group Ⅰ
    Strain distribution of graded release preload force of No. 4 bolt of group Ⅰ
    Fig. 13. Strain distribution of graded release preload force of No. 4 bolt of group Ⅰ
    CAD software to create 3D solid units
    Fig. 14. CAD software to create 3D solid units
    Longitudinal 4-bolt mid-span path strain distribution in group Ⅱ
    Fig. 15. Longitudinal 4-bolt mid-span path strain distribution in group Ⅱ
    Longitudinal 9-bolt mid-span path strain distribution in group Ⅰ
    Fig. 16. Longitudinal 9-bolt mid-span path strain distribution in group Ⅰ
    Distribution of peak unilateral 9-peg strain in group Ⅰ
    Fig. 17. Distribution of peak unilateral 9-peg strain in group Ⅰ
    Distribution of peak unilateral 9-bolt strain in group Ⅱ
    Fig. 18. Distribution of peak unilateral 9-bolt strain in group Ⅱ
    Distribution of peak unilateral 9-bolt strain in group Ⅲ
    Fig. 19. Distribution of peak unilateral 9-bolt strain in group Ⅲ
    Strain distribution of graded release preload force of No. 1 bolt of group Ⅰ
    Fig. 20. Strain distribution of graded release preload force of No. 1 bolt of group Ⅰ
    Strain distribution of graded release preload force of No. 4 bolt of group Ⅰ
    Fig. 21. Strain distribution of graded release preload force of No. 4 bolt of group Ⅰ
    Load /kgGroup 1Group 2

    Average

    strain /με

    Theoretical

    strain /με

    Inaccuracy /%
    Strain /μεStrain /μεStrain /μεStrain /με
    0.582.882.880.679.581.482.51.30
    1.0161.3160.8166.8167.7164.1165.10.64
    1.5243.5241.9246.0245.8244.3247.71.41
    2.0325.7323.8325.1325.3325.0330.21.60
    2.5399.3396.5400.4401.4399.4412.83.25
    3.0478.7479.0483.1484.3481.3495.42.82
    Table 1. Comparison of measured and theoretical strains of distributed optical fiber
    SerialnumberHigh-strength bolted jointsConnector coverConnector core plate
    Bolt length /mmQuantity /pairl×b×h /(mm×mm×mm)Quantity /piecel×b×h /(mm×mm×mm)Quantity /piece
    4-bolt808620×300×102400×300×202
    9-bolt8018620×300×102400×300×202
    Table 2. Geometric dimensions of bolted specimens and connected steel plates
    Dapeng Wang, Wei Dou. Identification of Bolt Preload Loss Before and After Corrosion Based on Optical Frequency Domain Reflection Technique[J]. Laser & Optoelectronics Progress, 2025, 62(3): 0306004
    Download Citation