• Laser & Optoelectronics Progress
  • Vol. 56, Issue 2, 023002 (2019)
Jingyu Li1, Kuan Chen2, Guofei Chen2, Yangyan Li1..., Aijun Zeng2 and Yu Xin1,*|Show fewer author(s)
Author Affiliations
  • 1 School of Electronic and Optical Engineering, Nanjing University of Science and Technology,Nanjing, Jiangsu 210094, China
  • 2 Nanjing Institute of Advanced Laser Technology, Nanjing, Jiangsu 210038, China
  • show less
    DOI: 10.3788/LOP56.023002 Cite this Article Set citation alerts
    Jingyu Li, Kuan Chen, Guofei Chen, Yangyan Li, Aijun Zeng, Yu Xin. Quantitative Analysis of Magnesium and Titanium Elements in Aluminum Alloy by Handheld Laser-Induced Breakdown Spectroscopy[J]. Laser & Optoelectronics Progress, 2019, 56(2): 023002 Copy Citation Text show less
    Schematic of optical path structure in handheld LIBS. (a) Path diagram of excitation light; (b) path diagram of signal light
    Fig. 1. Schematic of optical path structure in handheld LIBS. (a) Path diagram of excitation light; (b) path diagram of signal light
    Ray trace image simulated by ZEMAX
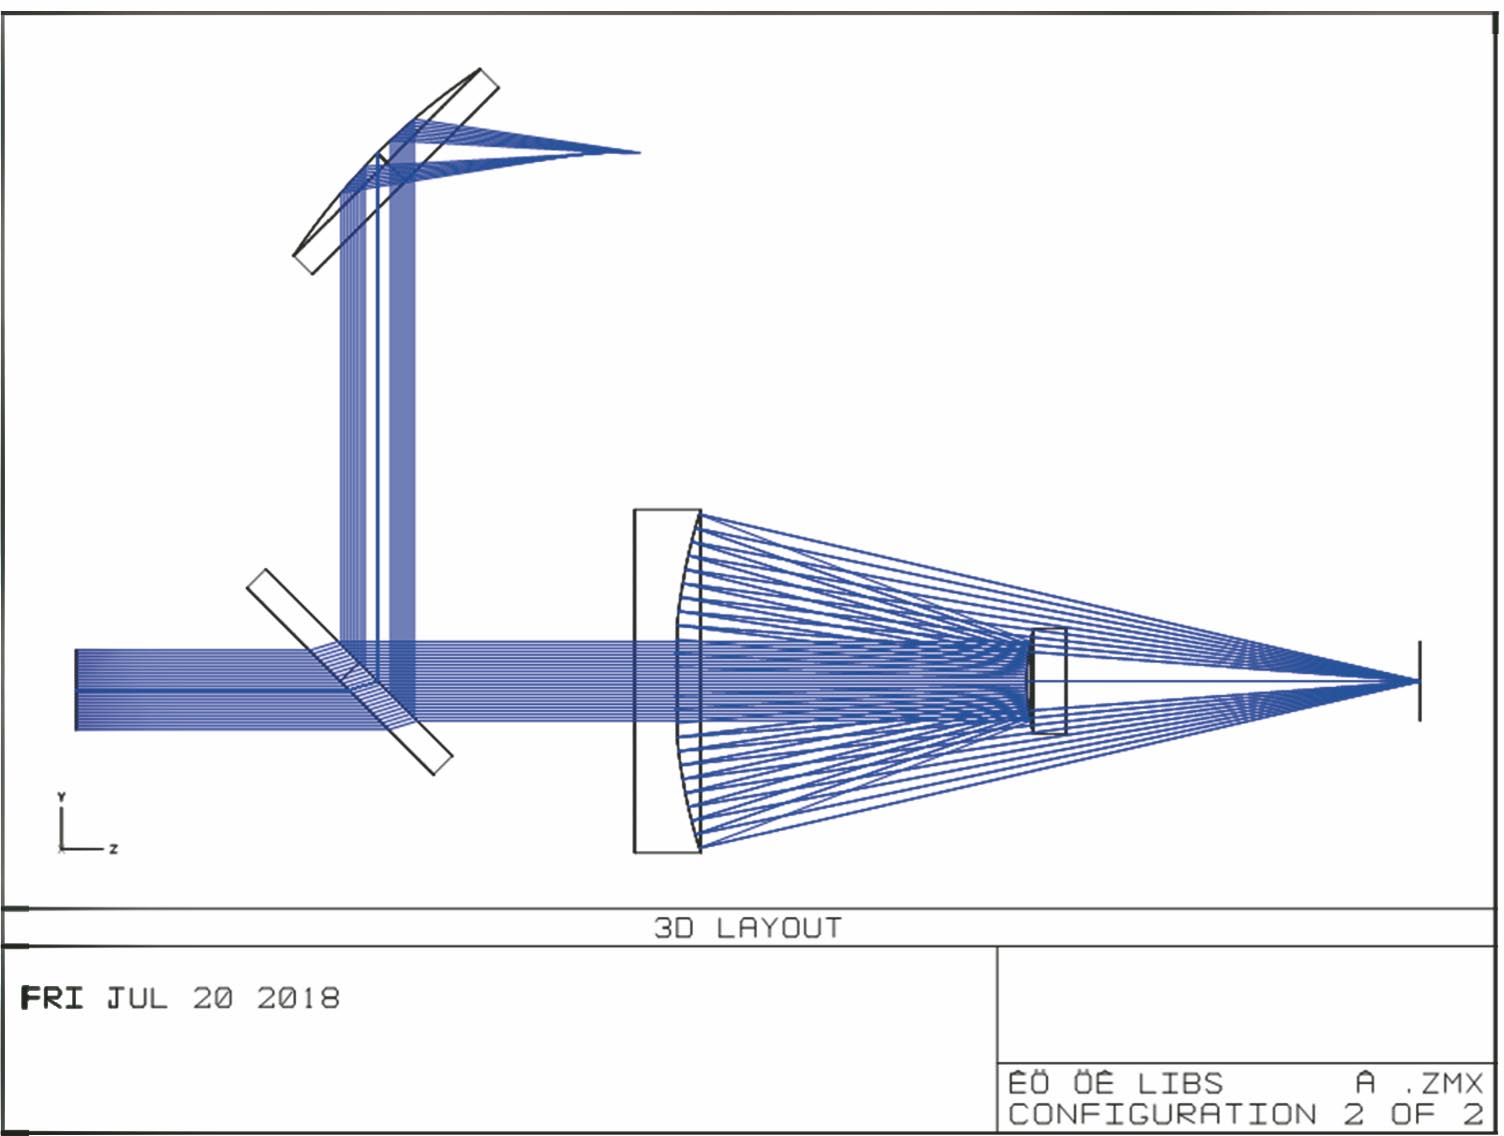
    Fig. 2. Ray trace image simulated by ZEMAX
    Experimental setup
    Fig. 3. Experimental setup
    Spectrogram. (a) Original signal spectrum; (b) processed signal spectrum
    Fig. 4. Spectrogram. (a) Original signal spectrum; (b) processed signal spectrum
    Spectrum of standard sample E111
    Fig. 5. Spectrum of standard sample E111
    Calibration curves of Mg element at 383.83 nm and 285.17 nm characteristic lines
    Fig. 6. Calibration curves of Mg element at 383.83 nm and 285.17 nm characteristic lines
    Calibration curves of Ti element at 323.38 nm and 336.12 nm characteristic lines
    Fig. 7. Calibration curves of Ti element at 323.38 nm and 336.12 nm characteristic lines
    No.TypeRadius /mmThickness /mmGlass
    1StandardInfinity20
    2TiltInfinity50K9
    3Standard24.628-26.701Mirror
    4Standard53.14556.520Mirror
    5StandardInfinity-56.520
    6Standard53.14526.701Mirror
    7Standard24.628-50Mirror
    8TiltInfinity40K9
    9Evenasphere-50.8-Mirror
    Table 1. Structural parameters of lens
    SamplenameMass fraction /%
    SiFeCuMnMgCrNiZnTiAl
    E1111.2500.8251.8801.2400.6920.0920.1610.4010.121Others
    E213b0.2870.3130.1291.5200.052-0.0750.0470.060Others
    E924d12.2901.0602.0200.2610.265-0.4271.5400.018Others
    60630.0980.1100.0120.4601.2100.310-0.0530.220Others
    E123a0.1270.3504.1100.5321.510-0.0370.1470.039Others
    Table 2. Sample names and compositions used for drawing calibration curves
    SamplenameMass fraction /%
    SiFeCuMnMgCrNiZnTiAl
    K60610.5880.2920.2780.1181.0500.2080.0310.1540.108Others
    K6063b0.4190.2230.0190.0200.5470.024-0.0270.023Others
    Table 3. Sample names and compositions used for verifying calibration curves
    SamplenameMass fraction of Mg /%Mass fraction of Ti /%
    285.17 nm383.83 nm323.45 nm334.94 nm
    StandardvalueMeasuredvalueRelativeerrorStandardvalueMeasuredvalueRelativeerrorStandardvalueMeasuredvalueRelativeerrorStandardvalueMeasuredvalueRelativeerror
    K60611.0501.0212.761.0501.0722.100.1080.1061.850.1080.1134.63
    K6063b0.5470.5867.130.5470.5561.650.0230.0224.350.0230.0258.70
    Table 4. Verification results and relative errors of sample
    ParameterMgTi
    285.17 nm383.83 nm323.45 nm334.94 nm
    Slope of calibration curve3410.063117.092205.072398.08
    Detection limit /(μg·g-1)564.8538.7405.6398.9
    Table 5. Detection limits of different spectral lines in element analysis
    Jingyu Li, Kuan Chen, Guofei Chen, Yangyan Li, Aijun Zeng, Yu Xin. Quantitative Analysis of Magnesium and Titanium Elements in Aluminum Alloy by Handheld Laser-Induced Breakdown Spectroscopy[J]. Laser & Optoelectronics Progress, 2019, 56(2): 023002
    Download Citation