• Acta Photonica Sinica
  • Vol. 53, Issue 1, 0104001 (2024)
Bin LI1, Xiaofang WANG2,3, Yan KANG2,*, Yazhou YUE1..., Weiwei LI2,3, Yixin ZHANG1, Hongjie LEI1 and Tongyi ZHANG2,3,**|Show fewer author(s)
Author Affiliations
  • 1Xi'an Flight Automatic Control Research Institute,Aviation Industry Corporation of China,Xi'an 710065,China
  • 2State Key Laboratory of Transient Optics and Photonics,Xi'an Institute of Optics and Precision Mechanics,Chinese Academy of Sciences,Xi'an 710119,China
  • 3University of Chinese Academy of Sciences,Beijing 100049,China
  • show less
    DOI: 10.3788/gzxb20245301.0104001 Cite this Article
    Bin LI, Xiaofang WANG, Yan KANG, Yazhou YUE, Weiwei LI, Yixin ZHANG, Hongjie LEI, Tongyi ZHANG. Experimental Analysis of Coherent Velocity Measurement Based on Near-infrared Single-element SPAD Detector[J]. Acta Photonica Sinica, 2024, 53(1): 0104001 Copy Citation Text show less
    Schematic of single photon heterodyne velocity measurement experimental system
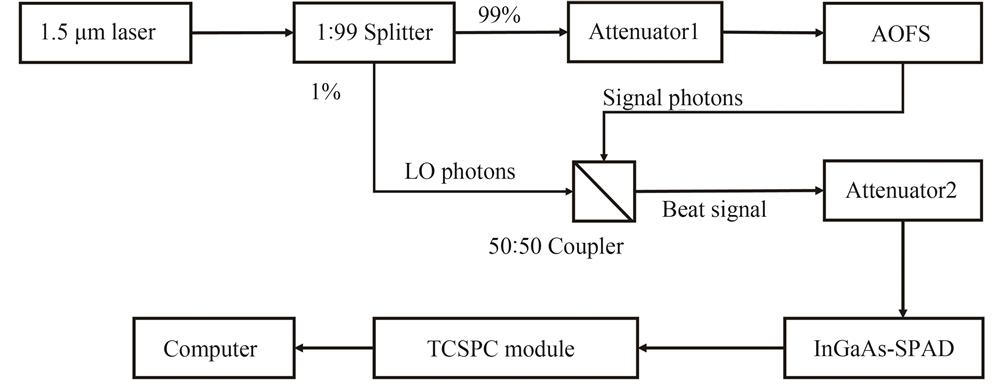
    Fig. 1. Schematic of single photon heterodyne velocity measurement experimental system
    Photograph of single photon heterodyne velocity measurement experimental system
    Fig. 2. Photograph of single photon heterodyne velocity measurement experimental system
    Data processing flow of coherent beat signal spectrum analysis
    Fig. 3. Data processing flow of coherent beat signal spectrum analysis
    The spectrums of the beat frequency signal under PCR of 134,270,428,545,640,800,902 and 920 kHz,respectively,DCR=1.8 kHz
    Fig. 4. The spectrums of the beat frequency signal under PCR of 134,270,428,545,640,800,902 and 920 kHz,respectively,DCR=1.8 kHz
    The signal amplitude,noise amplitude and SNR of spectrum under different PCR,DCR=1.8 kHz
    Fig. 5. The signal amplitude,noise amplitude and SNR of spectrum under different PCR,DCR=1.8 kHz
    The spectrums of the beat frequency signal under PCR of 200,350,490,610,720,830,902,920,928,946,965,978,992,994,997 and 1 009 kHz,DCR=52.4 kHz
    Fig. 6. The spectrums of the beat frequency signal under PCR of 200,350,490,610,720,830,902,920,928,946,965,978,992,994,997 and 1 009 kHz,DCR=52.4 kHz
    Enlarged partial view of harmonic components in Fig.6(j),(m),(p)
    Fig. 7. Enlarged partial view of harmonic components in Fig.6(j),(m),(p)
    The signal amplitude,noise amplitude and SNR of spectrum under different PCR,DCR=52.4 kHz
    Fig. 8. The signal amplitude,noise amplitude and SNR of spectrum under different PCR,DCR=52.4 kHz
    The spectrum of the beat frequency signal under different photon count rates,DCR=194.4 kHz
    Fig. 9. The spectrum of the beat frequency signal under different photon count rates,DCR=194.4 kHz
    The signal amplitude,noise amplitude and SNR of spectrum under different PCR,DCR=194.4 kHz
    Fig. 10. The signal amplitude,noise amplitude and SNR of spectrum under different PCR,DCR=194.4 kHz
    ParametersValue
    Laser wavelength1 549.5 nm
    Laser linewidth<200 Hz
    DetectorInGaAs-SPAD
    SPAD's dead time1 μs
    SPAD's dark count rate1.8 kHz,52.4 kHz,194.4 kHz
    SPAD's quantum efficiency2.5%,5%,7.5%
    SPAD's time resolution200 ps
    Simulated velocity value30 m/s
    Acquisition time1 ms
    Table 1. System parameters
    PCR/kHz200350490610720830902920
    SNR0.94.56.69.610.411.111.810.3
    PCR/kHz9289469659789929949971 009
    SNR10.610.910.19.89.810.611.010.3
    Table 2. SNR of spectrum under different photon count rates,DCR=52.4 kHz
    PCR/kHz4836077128019089609961 002
    SNR3.65.79.110.312.212.012.611.8
    Table 3. SNR of spectrum under different PCR,@DCR=194.4 kHz
    Bin LI, Xiaofang WANG, Yan KANG, Yazhou YUE, Weiwei LI, Yixin ZHANG, Hongjie LEI, Tongyi ZHANG. Experimental Analysis of Coherent Velocity Measurement Based on Near-infrared Single-element SPAD Detector[J]. Acta Photonica Sinica, 2024, 53(1): 0104001
    Download Citation