• Laser & Optoelectronics Progress
  • Vol. 60, Issue 19, 1923003 (2023)
Lü Xin1,2, Mingyao Zhu1,2, Keyu Pan1,2, Mingbo Chi1,**, and Yihui Wu1,*
Author Affiliations
  • 1Key Laboratory of Optical System Advanced Manufacturing Technology, Changchun Institute of Optics, Fine Mechanics and Physics, Chinese Academy of Sciences, Changchun 130033, Jilin , China
  • 2University of Chinese Academy of Sciences, Beijing 100049, China
  • show less
    DOI: 10.3788/LOP221607 Cite this Article Set citation alerts
    Lü Xin, Mingyao Zhu, Keyu Pan, Mingbo Chi, Yihui Wu. Stray Light Suppression of Single-Cell Raman Spectrometer[J]. Laser & Optoelectronics Progress, 2023, 60(19): 1923003 Copy Citation Text show less
    System structure. (a) Schematic diagram; (b) simulation diagram
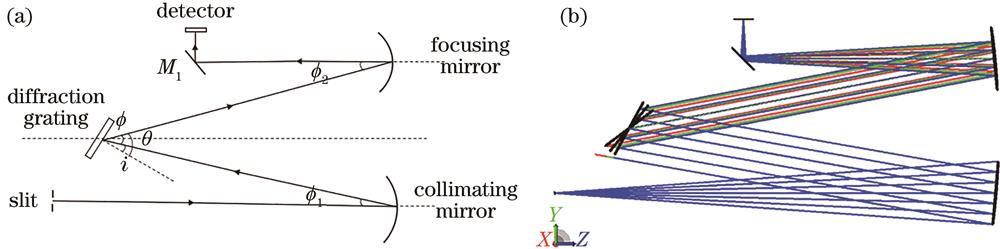
    Fig. 1. System structure. (a) Schematic diagram; (b) simulation diagram
    Mechanical assembly drawing of the Raman spectrometer system
    Fig. 2. Mechanical assembly drawing of the Raman spectrometer system
    Main distribution of stray light
    Fig. 3. Main distribution of stray light
    Ray tracing diagrams of Raman spectrometer system before adding the suppression structure. (a) 530 nm; (b) 710 nm; (c) 880 nm
    Fig. 4. Ray tracing diagrams of Raman spectrometer system before adding the suppression structure. (a) 530 nm; (b) 710 nm; (c) 880 nm
    Schematic diagrams of optical trap parameter calculation. (a) Overall design of optical trap; (b) 90° angle optical trap; (c) non-90° angle optical trap
    Fig. 5. Schematic diagrams of optical trap parameter calculation. (a) Overall design of optical trap; (b) 90° angle optical trap; (c) non-90° angle optical trap
    Mechanical assembly drawing after adding the suppression structure
    Fig. 6. Mechanical assembly drawing after adding the suppression structure
    Ray tracing diagrams of Raman spectrometer system after adding the suppression structure. (a) 530 nm; (b) 710 nm; (c) 880 nm
    Fig. 7. Ray tracing diagrams of Raman spectrometer system after adding the suppression structure. (a) 530 nm; (b) 710 nm; (c) 880 nm
    Stray radiation ratios at different wavelengths
    Fig. 8. Stray radiation ratios at different wavelengths
    Irradiance analysis of detector surface before and after adding the suppression structure at the central wavelength of 568 nm. (a) Before adding the suppression structure; (b) after adding the suppression structure
    Fig. 9. Irradiance analysis of detector surface before and after adding the suppression structure at the central wavelength of 568 nm. (a) Before adding the suppression structure; (b) after adding the suppression structure
    ParameterValue
    Spectral range /nm530~1000
    Spectral resolution /nm0.06
    Slit width /um50
    Grating of groove spacing /(lp·mm-11/1800
    Single pixel size /(μm×μm)16×16
    Number of valid pixel /(pixel×pixel)1000×200
    Table 1. Performance parameters of the Raman spectrometer
    ParameterValue
    Light sourceGrid source
    Mirror reflectivity /%95
    Image planePerfect absorb
    Absorptivity of internal surface of mechanical structure /%90
    Scattering modelABg function
    Table 2. Simulation parameters of the Raman spectrometer
    Lü Xin, Mingyao Zhu, Keyu Pan, Mingbo Chi, Yihui Wu. Stray Light Suppression of Single-Cell Raman Spectrometer[J]. Laser & Optoelectronics Progress, 2023, 60(19): 1923003
    Download Citation