• Laser & Optoelectronics Progress
  • Vol. 60, Issue 13, 1330001 (2023)
Shihang Chen1, Li Liu1,2, Zhiwei Deng1, Zhongqi Hao1,2,*..., Jiulin Shi1,2 and Xingdao He1,2|Show fewer author(s)
Author Affiliations
  • 1Jiangxi Province Key Laboratory of Optoelectronic Information Science and Technology, Nanchang Hangkong University, Nanchang 330063, Jiangxi, China
  • 2Jiangxi Province Optoelectronic Detection Technology Engineering Laboratory, Nanchang Hangkong University, Nanchang 330063, Jiangxi, China
  • show less
    DOI: 10.3788/LOP230706 Cite this Article Set citation alerts
    Shihang Chen, Li Liu, Zhiwei Deng, Zhongqi Hao, Jiulin Shi, Xingdao He. Detection of Tantalum-Niobium Ores Using Double-Pulse Laser-Induced Breakdown Spectroscopy Based on a Single Laser[J]. Laser & Optoelectronics Progress, 2023, 60(13): 1330001 Copy Citation Text show less
    Schematic diagram of the experimental setup
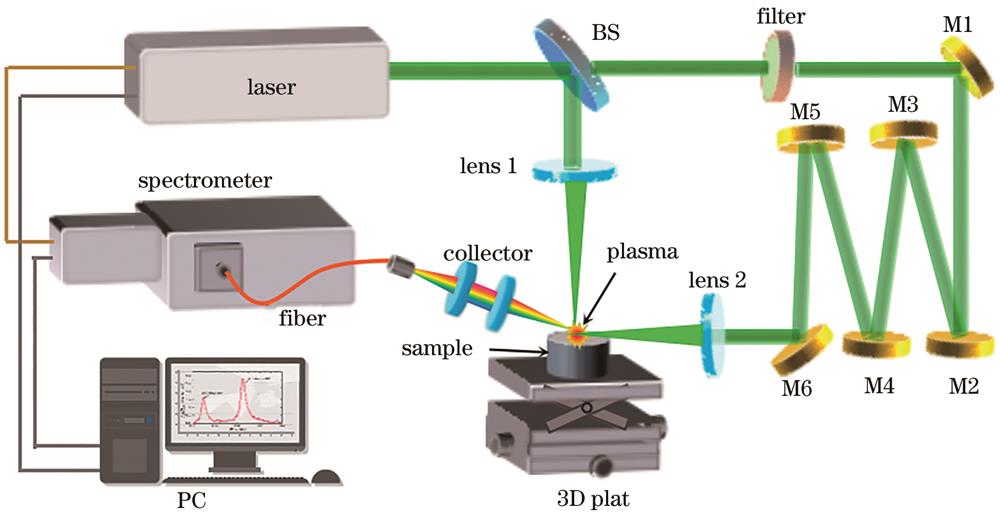
    Fig. 1. Schematic diagram of the experimental setup
    Variation of the intensity of the spectral lines with the amount of defocusing. (a) Reflected light; (b) transmitted light
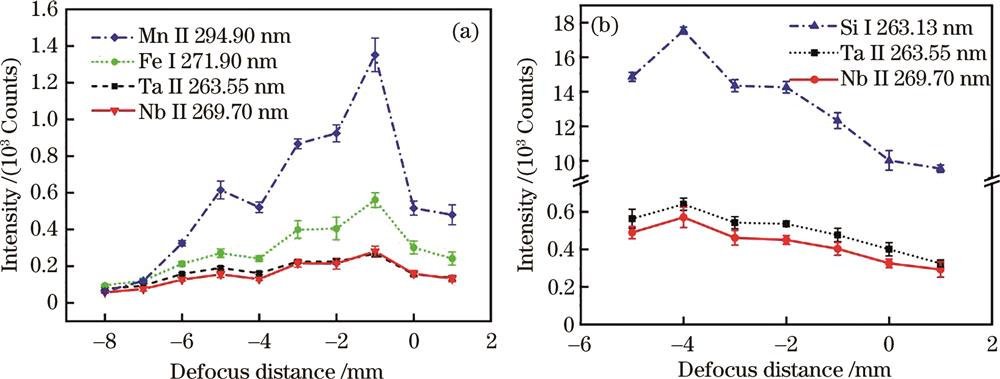
    Fig. 2. Variation of the intensity of the spectral lines with the amount of defocusing. (a) Reflected light; (b) transmitted light
    Variation of SNR with laser pulse energy: (a) Reflected light; (b) transmitted light
    Fig. 3. Variation of SNR with laser pulse energy: (a) Reflected light; (b) transmitted light
    SNR of elemental characteristic spectral line as a function of the delay time under SP- and DP-LIBS
    Fig. 4. SNR of elemental characteristic spectral line as a function of the delay time under SP- and DP-LIBS
    Elemental spectral line intensities of LIBS under single and double pulse conditions. (a) Ta; (b) Nb
    Fig. 5. Elemental spectral line intensities of LIBS under single and double pulse conditions. (a) Ta; (b) Nb
    Basic calibration curves under SP-LIBS and DP-LIBS. (a) Ta II 263.55 nm; (b) Nb II 269.70 nm
    Fig. 6. Basic calibration curves under SP-LIBS and DP-LIBS. (a) Ta II 263.55 nm; (b) Nb II 269.70 nm
    Sample No.GBW07154∶GBW07155Ta /(μg·g-1Nb /(μg·g-1
    110∶072.629.6
    29∶1523.2273.4
    38∶2473.1246.4
    47∶3423.0219.2
    56∶4373.0192.2
    65∶5322.9165.1
    74∶6272.8138.0
    83∶7222.8110.9
    92∶8172.783.8
    101∶9122.656.7
    110∶10573.2300.6
    Table 1. Contents of Ta and Nb in tantalum-niobium ore samples
    ElementR2Detection limits /(μg·g-1
    SP-LIBSDP-LIBSSP-LIBSDP-LIBS
    Ta0.8260.975435.65195.91
    Nb0.9660.990121.9981.79
    Table 2. Comparison of quantitative analysis results between SP-LIBS and DP-LIBS
    Shihang Chen, Li Liu, Zhiwei Deng, Zhongqi Hao, Jiulin Shi, Xingdao He. Detection of Tantalum-Niobium Ores Using Double-Pulse Laser-Induced Breakdown Spectroscopy Based on a Single Laser[J]. Laser & Optoelectronics Progress, 2023, 60(13): 1330001
    Download Citation