• Laser & Optoelectronics Progress
  • Vol. 60, Issue 17, 1730006 (2023)
Chaochao Pan1,2,3, Nanjing Zhao2,3,*, Mingjun Ma1,2,3, Ruifang Yang2,3..., Jingqiang Yang2,3 and Jianguo Liu2,3|Show fewer author(s)
Author Affiliations
  • 1School of Environment Science and Optoelectronic Technology, University of Science and Technology of China, Hefei 230026, Anhui , China
  • 2Key Laboratory of Environment Optics and Technology, Anhui Institute of Optics and Fine Mechanics, Chinese Academy of Sciences, Hefei 230031, Anhui , China
  • 3Key Laboratory of Optical Monitoring Technology for Environment, Hefei 230031, Anhui , China
  • show less
    DOI: 10.3788/LOP220961 Cite this Article Set citation alerts
    Chaochao Pan, Nanjing Zhao, Mingjun Ma, Ruifang Yang, Jingqiang Yang, Jianguo Liu. Highly Sensitive Detection of Cd in Soil Using Laser-Induced Breakdown Spectroscopy[J]. Laser & Optoelectronics Progress, 2023, 60(17): 1730006 Copy Citation Text show less
    Schematic diagram of experimental setup
    Fig. 1. Schematic diagram of experimental setup
    Effects of different mass fractions of NaCl doping on the intensity of Cd 214.441 nm characteristic line
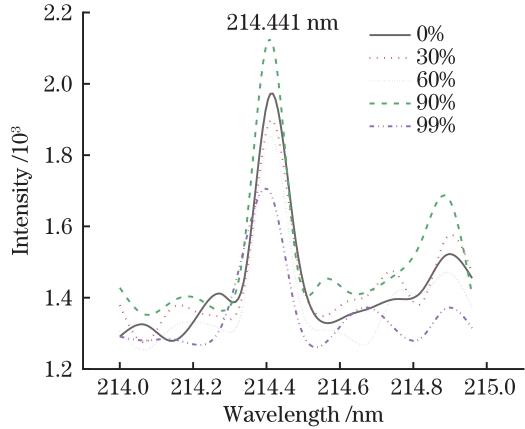
    Fig. 2. Effects of different mass fractions of NaCl doping on the intensity of Cd 214.441 nm characteristic line
    Effects of different mass fractions of NaCl doping on the intensity of Cd 228.802 nm characteristic line
    Fig. 3. Effects of different mass fractions of NaCl doping on the intensity of Cd 228.802 nm characteristic line
    Effects of doping NaCl mass fraction on the intensity of Cd 214.441 nm and Cd 228.802 nm characteristic lines
    Fig. 4. Effects of doping NaCl mass fraction on the intensity of Cd 214.441 nm and Cd 228.802 nm characteristic lines
    Effects of NaCl mass fraction on the SBR of Cd 214.441 nm and Cd 228.802 nm characteristic lines
    Fig. 5. Effects of NaCl mass fraction on the SBR of Cd 214.441 nm and Cd 228.802 nm characteristic lines
    Calibration curves of Cd 214.441 nm in soils doped with 90% NaCl mass fraction and undoped NaCl
    Fig. 6. Calibration curves of Cd 214.441 nm in soils doped with 90% NaCl mass fraction and undoped NaCl
    Calibration curves of Cd 228.802 nm in soils doped with 90% NaCl mass fraction and undoped NaCl
    Fig. 7. Calibration curves of Cd 228.802 nm in soils doped with 90% NaCl mass fraction and undoped NaCl
    Boltzmann curves of multispectral lines with different NaCl doping mass fractions. (a) 0%; (b) 30%; (c) 60%; (d) 90%
    Fig. 8. Boltzmann curves of multispectral lines with different NaCl doping mass fractions. (a) 0%; (b) 30%; (c) 60%; (d) 90%
    Effects of doping NaCl mass fraction on plasma temperature
    Fig. 9. Effects of doping NaCl mass fraction on plasma temperature
    Effects of doping NaCl mass fraction on plasma eletron density
    Fig. 10. Effects of doping NaCl mass fraction on plasma eletron density
    Characteristic parameterGBW07494GBW07496GBW07497
    Cl-13±337±516±3
    Mg2+12.7±1.453±631±4
    K+35±4117±784±11
    Na+24±357±542±7
    Cu-DTPA2.23±0.123.74±0.252.16±0.16
    Zn-DTPA1.19±0.131.66±0.212.62±0.29
    Fe-DTPA150±6163±13210±16
    Mn-DTPA28±440±552±6
    Cd-DTPA0.028±0.0070.038±0.0040.062±0.008
    Pb-DTPA1.34±0.112.19±0.202.47±0.20
    Ni-DTPA0.50±0.070.86±0.061.00±0.10
    Co-DTPA0.25±0.040.35±0.040.44±0.07
    Table 1. Analysis of the standard value and uncertainty of the standard matter of the active component in the three standard soils
    Mass fraction of NaCl /%Mass before measurement /gMass after measurement /gAblative mass /g
    02.96282.95670.0061
    102.96502.95980.0052
    202.91082.90480.0060
    302.97022.96440.0058
    402.90692.90140.0055
    502.96342.95830.0051
    602.97682.96950.0073
    702.97192.96360.0083
    802.97212.96330.0088
    902.97022.96180.0084
    992.98502.97400.0110
    Table 2. Mass changes of soil flake samples with different NaCl doping mass fractions safter 50 monopulse measurements
    Wavelength /nmgAE /cm-1
    388.62803.70×10726140.179
    367.99101.24×10727166.820
    344.06061.20×10829056.324
    382.04256.00×10833095.941
    303.73801.46×10833801.572
    356.53803.86×10835767.564
    404.58107.76×10836686.176
    Table 3. Parameters of the selected seven iron element characteristic lines
    Chaochao Pan, Nanjing Zhao, Mingjun Ma, Ruifang Yang, Jingqiang Yang, Jianguo Liu. Highly Sensitive Detection of Cd in Soil Using Laser-Induced Breakdown Spectroscopy[J]. Laser & Optoelectronics Progress, 2023, 60(17): 1730006
    Download Citation