Author Affiliations
1Guangzhou Institute of Geography, Guangdong Academy of Sciences, Guangzhou 510070, Guangdong, China2School of Civil and Transportation Engineering, Guangdong University of Technology, Guangzhou 510006, Guangdong, China3Southern Marine Science and Engineering Guangdong Laboratory (Guangzhou), Guangzhou 511458, Guangdong, Chinashow less
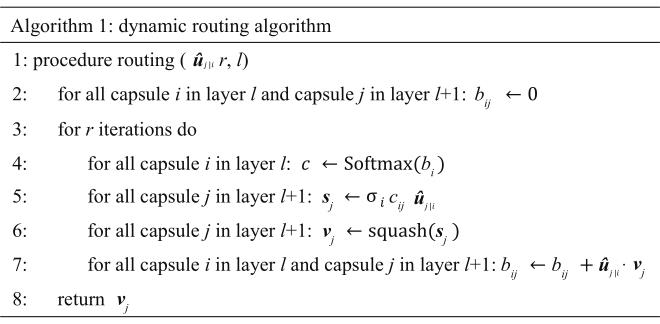
Fig. 1. Flowchart of dynamic routing algorithm
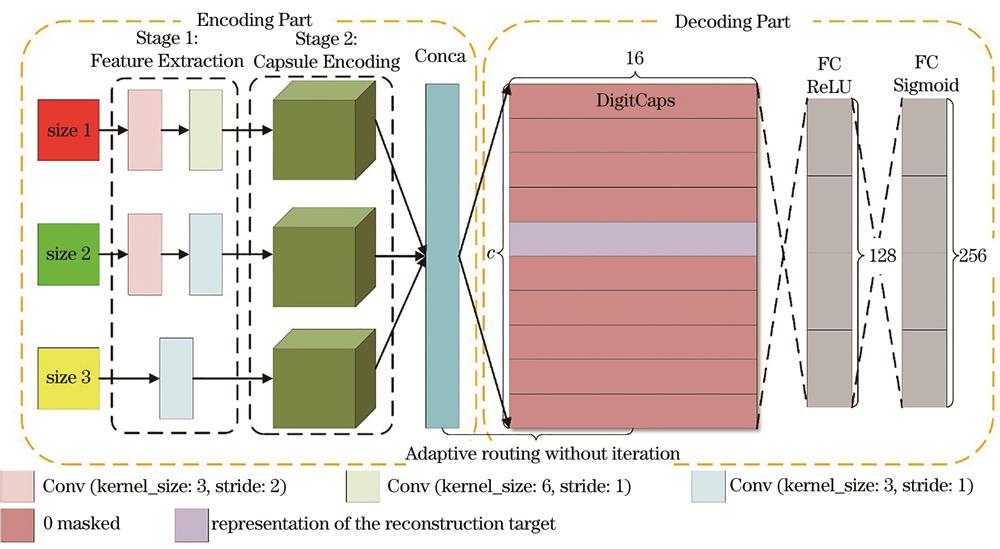
Fig. 2. MSCaps architecture
Fig. 3. Flowchart of adaptive routing algorithm without iteration
Fig. 4. Experimental dataset 1. (a) PU dataset; (b) ground truth of PU dataset
Fig. 5. Experimental dataset 2. (a) SA dataset; (b) ground truth of SA dataset
Fig. 6. Network architectures of MSCNN and MSCaps
Fig. 7. Classification accuracy under different input sizes
Fig. 8. Classification results of different algorithms on PU dataset
Fig. 9. Classification results of different algorithms on SA dataset
Fig. 10. Training time of each model on PU and SA datasets
Class No. | Land cover | Training | Validation | Test |
---|
1 | Asphalt | 1000 | 1000 | 4631 | 2 | Meadows | 1000 | 1001 | 16650 | 3 | Gravel | 460 | 461 | 1180 | 4 | Trees | 890 | 891 | 1285 | 5 | Painted metal sheets | 400 | 401 | 546 | 6 | Bare Soil | 1000 | 1001 | 3030 | 7 | Bitumen | 400 | 401 | 531 | 8 | Self-Blocking Bricks | 1000 | 1001 | 1683 | 9 | Shadows | 260 | 261 | 428 |
|
Table 1. Number of training, verification, and test samples of various types of objects on PU dataset
Class No. | Land cover | Training | Validation | Test |
---|
1 | Brocoli_green_weeds_1 | 100 | 100 | 191 | 2 | Corn_senesced_green_weeds | 390 | 390 | 563 | 3 | Lettuce_romaine_4wk | 150 | 150 | 316 | 4 | Lettuce_romaine_5wk | 470 | 470 | 585 | 5 | Lettuce_romaine_6wk | 210 | 210 | 254 | 6 | Lettuce_romaine_7wk | 250 | 250 | 299 |
|
Table 2. Number of training, verification, and test samples of various types of objects on SA dataset
No. | Accuracy /% |
---|
SVM | RF | PCA-SVM | PCA-RF | CNN | CapsNet | MCaps | ARWI-Caps | MSCNN | MSCaps |
---|
1 | 99.21 | 98.89 | 99.38 | 97.56 | 99.37 | 98.05 | 99.09 | 99.42 | 99.44 | 99.49 | 2 | 98.99 | 98.32 | 98.87 | 98.24 | 99.78 | 99.96 | 99.93 | 99.97 | 99.51 | 99.97 | 3 | 76.32 | 79.94 | 76.83 | 89.77 | 76.39 | 95.35 | 96.19 | 98.49 | 98.45 | 98.31 | 4 | 95.91 | 89.58 | 95.86 | 87.10 | 98.96 | 92.76 | 95.46 | 95.77 | 99.74 | 97.15 | 5 | 99.85 | 99.48 | 99.85 | 99.85 | 99.93 | 96.13 | 98.82 | 99.70 | 99.56 | 99.85 | 6 | 90.12 | 81.42 | 89.86 | 82.98 | 98.13 | 98.45 | 99.41 | 99.83 | 99.23 | 99.84 | 7 | 92.38 | 88.35 | 92.52 | 96.38 | 98.30 | 99.33 | 99.25 | 99.89 | 98.81 | 99.92 | 8 | 93.39 | 91.31 | 93.45 | 89.68 | 97.64 | 97.88 | 99.48 | 99.51 | 98.17 | 99.62 | 9 | 100 | 99.79 | 100 | 99.89 | 99.58 | 97.15 | 97.95 | 99.68 | 98.03 | 99.89 | OA /% | 91.60 | 87.38 | 91.86 | 88.44 | 95.84 | 96.73 | 98.22 | 98.96 | 98.71 | 99.14 | K | 0.82 | 0.74 | 0.84 | 0.76 | 0.91 | 0.93 | 0.96 | 0.97 | 0.97 | 0.99 | p | | 0.0 | | | | | | 0.011 | 1.501×10⁻⁵ | |
|
Table 3. Accuracy, overall accuracy, Kappa coefficient (K), and p-value of different algorithms on PU dataset
No. | Accuracy /% |
---|
SVM | RF | PCA-SVM | PCA-RF | CNN | CapsNet | MCaps | ARWI-Caps | MSCNN | MSCaps |
---|
1 | 100 | 100 | 100 | 100 | 99.74 | 100 | 98.73 | 96.54 | 100 | 100 | 2 | 100 | 97.08 | 99.26 | 96.99 | 93.26 | 100 | 100 | 100 | 100 | 100 | 3 | 99.84 | 99.83 | 99.88 | 100 | 93.92 | 100 | 100 | 100 | 100 | 100 | 4 | 99.35 | 99.09 | 99.35 | 98.58 | 99.08 | 90.55 | 99.74 | 99.87 | 99.54 | 99.87 | 5 | 87.53 | 65.31 | 86.86 | 71.17 | 93.48 | 98.39 | 89.99 | 96.70 | 96.70 | 100 | 6 | 72.70 | 80.75 | 73.64 | 92.26 | 84.36 | 87.71 | 89.92 | 92.15 | 88.96 | 88.88 | OA/% | 81.57 | 73.41 | 82.13 | 82.21 | 85.01 | 87.27 | 92.16 | 95.10 | 94.07 | 95.38 | K | 0.66 | 0.52 | 0.69 | 0.67 | 0.72 | 0.76 | 0.85 | 0.90 | 0.89 | 0.91 | p | | | | | | | | 0.033 | 0.025 | |
|
Table 4. Accuracy, overall accuracy, Kappa coefficient (K), and p-value of different algorithms on SA dataset