• Optics and Precision Engineering
  • Vol. 30, Issue 12, 1440 (2022)
Xiaolei DENG1,*, Yushen CHEN2, Shupeng GUO1, Jiacong ZHENG1, and Xiaobo SHENG1
Author Affiliations
  • 1Key Laboratory of Air-driven Equipment Technology of Zhejiang Province, Quzhou University, Quzhou324000, China
  • 2College of Mechanical Engineering, Zhejiang University of Technology, Hangzhou31003, China
  • show less
    DOI: 10.37188/OPE.20223012.1440 Cite this Article
    Xiaolei DENG, Yushen CHEN, Shupeng GUO, Jiacong ZHENG, Xiaobo SHENG. Multi-source heterogeneous information acquiring test experiment and platform construction for CNC machine tool[J]. Optics and Precision Engineering, 2022, 30(12): 1440 Copy Citation Text show less
    Main structure 3D model of VM-850L machining center
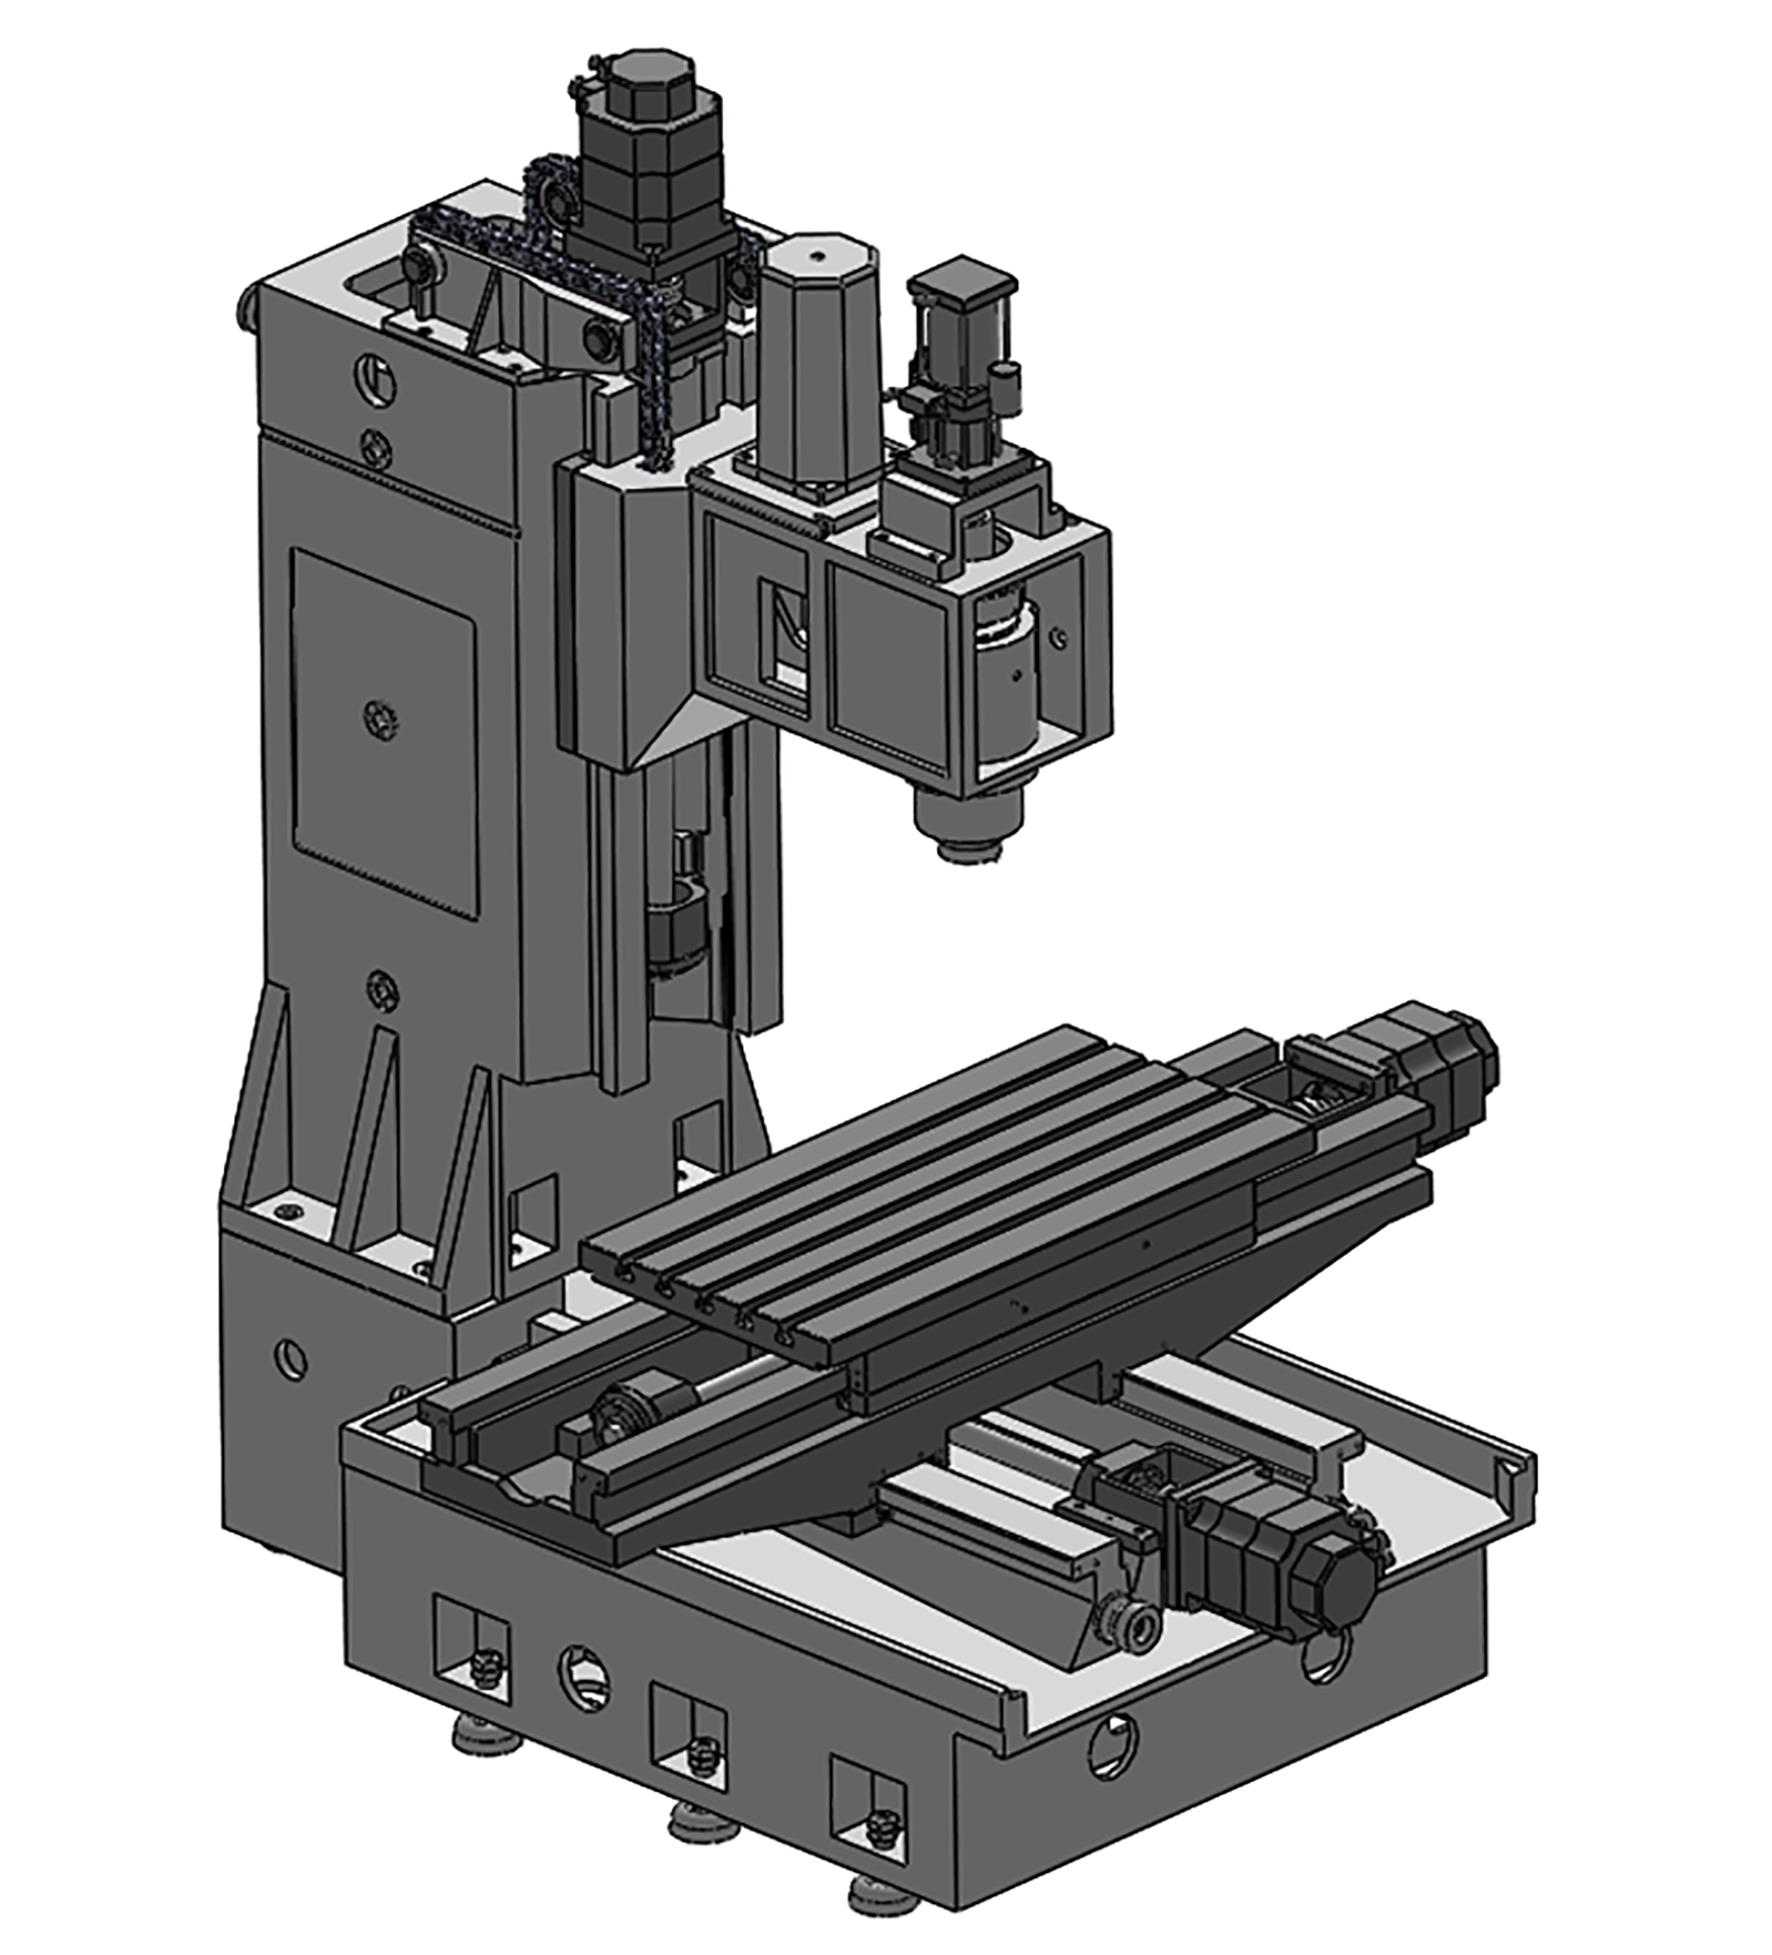
    Fig. 1. Main structure 3D model of VM-850L machining center
    Schematic diagram of each section of spindle
    Fig. 2. Schematic diagram of each section of spindle
    Cloud diagram of temperature field distribution at different rotational speed
    Fig. 3. Cloud diagram of temperature field distribution at different rotational speed
    Steady-state temperature field recorded by thermal imager
    Fig. 4. Steady-state temperature field recorded by thermal imager
    Cloud diagram of thermal displacement distribution at each rotational speed
    Fig. 5. Cloud diagram of thermal displacement distribution at each rotational speed
    Test instrument on test platform
    Fig. 6. Test instrument on test platform
    Data acquisition principle
    Fig. 7. Data acquisition principle
    Multi-source heterogeneous information collection test platform
    Fig. 8. Multi-source heterogeneous information collection test platform
    Schematic diagram of measuring point layout
    Fig. 9. Schematic diagram of measuring point layout
    Temperature data of each measuring point at different speeds
    Fig. 10. Temperature data of each measuring point at different speeds
    Signal of vibration measuring points at different speeds
    Fig. 11. Signal of vibration measuring points at different speeds
    Signal of Z-direction displacement at different speeds
    Fig. 12. Signal of Z-direction displacement at different speeds
    Structure of RBF neural network
    Fig. 13. Structure of RBF neural network
    Displacement prediction curve of RBF neural network
    Fig. 14. Displacement prediction curve of RBF neural network

    转速/

    (r·min-1

    电机功率/kW

    单列

    轴承1/W

    单列

    轴承2/W

    2 0007.527.052 627.052 6
    3 0007.552.405 152.405 1
    4 0007.583.948 083.948 0
    Table 1. Heat flow of each part at different speeds

    转速/

    (r·min-1

    α/(W·m-2·K-1
    D1D2D3D4D5
    200043.946.350.862.156.2
    300060.764.070.285.977.8
    400076.580.688.4108.197.9
    Table 2. Heat transfer coefficient of each shaft section at different speeds
    面位置α/(W·m-2·K-1
    顶面9.855
    侧面9.310
    底面7.303
    Table 3. Total heat transfer coefficient on each face of headstock with air
    传感器类型测点位置测点对应代号
    温度传感器主轴侧面T1
    主轴侧面T2
    主轴侧面T3
    法兰底面T4
    主轴箱正面T5
    主轴箱内部T6
    主轴箱侧面T7
    主轴箱内部T8
    环境温度T9
    加速度传感器工作台A1
    主轴箱侧面A2
    主轴正面A3
    主轴箱正面A4
    主轴箱正面A5
    工作台A6
    主轴箱正面A7
    主轴箱侧面A8
    位移传感器检验棒X方向X1
    检验棒X方向X2
    检验棒Y方向Y1
    检验棒Y方向Y2
    检验棒Z方向Z
    Table 4. Location description of measuring points

    转速/

    (r·min-1

    仿真/μm试验/μm相对误差/%
    2 00011.33012.2507.51
    3 00012.28611.5656.23
    4 00013.49013.0653.25
    Table 5. Comparative analysis results of Z- direction thermal deformation of spindle at different speeds
    转速/(r·min-1MAE/μmRMSE/μmR2
    2 0000.6830.8900.936 7
    3 0000.6020.6320.956 7
    4 0000.4830.7260.940 9
    Table 6. Model prediction performance evaluation
    Xiaolei DENG, Yushen CHEN, Shupeng GUO, Jiacong ZHENG, Xiaobo SHENG. Multi-source heterogeneous information acquiring test experiment and platform construction for CNC machine tool[J]. Optics and Precision Engineering, 2022, 30(12): 1440
    Download Citation