
Changyu Shen, Wenbo Sui, Jun Zhou, Wei Han, Jie Dong, Bin Fang, Zhaokun Wang. Review of Biosensors Based on Surface Plasmon Resonance[J]. Laser & Optoelectronics Progress, 2023, 60(11): 1106004
- Laser & Optoelectronics Progress
- Vol. 60, Issue 11, 1106004 (2023)

Fig. 1. Schematic diagram of SPR
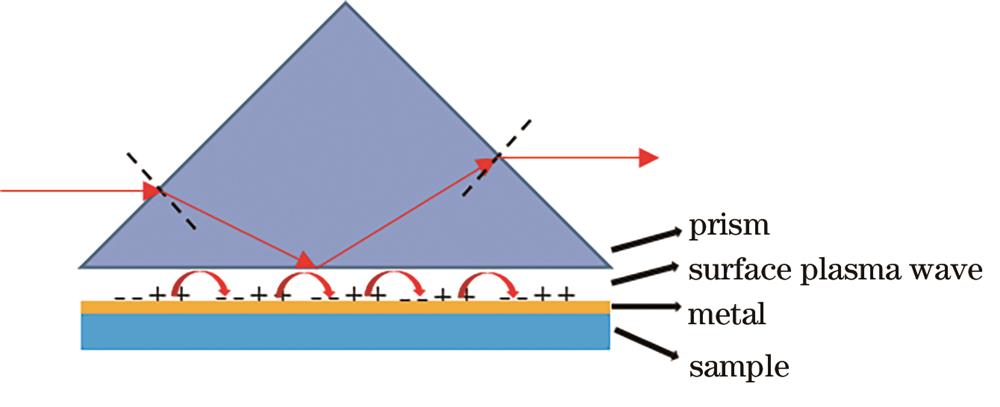
Fig. 2. Schematic diagram of the Otto model
Fig. 3. Schematic diagram of the Kretschmann model
Fig. 4. Experimental setup of the SPR phase shift based on the differential between the s and p polarizations[30]
Fig. 5. Schematic of porous silicon membrane waveguide biosensor[31]
Fig. 6. Schematic illustration of the SPR setup in the spectral interrogation mode[32]
Fig. 7. SPR setup using half cylindrical prism as light coupler[33]
Fig. 8. SMI-based SPR system[34]
Fig. 9. Schematic diagram of an SPR spectroscopic ellipsometry setup[35]
Fig. 10. Measurement of optical rotation angle and refractive index of sugar and amino acid by SPR combined with WVA[36]
Fig. 11. Schematic diagram of the SPRCD sensor[37]
Fig. 12. Grating-coupled SPR sensor based on polarization modulation[38]
Fig. 13. Schematic illustration of surface plasmon resonance imaging platform integrated with a smartphone[39]
Fig. 14. Grating coupled SPRi sensor chip. (a) Schematic of the SPRi chip assembly fabricated by integrating a bimetallic blu-ray disc chip and a disposable fluidic channel[39]; (b) cross-section schematic view[39]
Fig. 15. Schematic showing the metal grating based on the DVD-R disc[40]
Fig. 16. Layout of Lumerical software 3D simulation of 50 nm AuNP on the CGN surface[41]
Fig. 17. Heterodyne source coupled in and out of a D-type optical fiber biosensor[54]
Fig. 18. Structure of the U-shaped optical fiber sensor[55]
Fig. 19. Schematic of the experimental setup of the multitapered fiber-optic SPR sensor[56]
Fig. 20. Schematic of the sensor based on MZI[57]
Fig. 21. Structure of fiber optic sensors[58]. (a) Cross-section of the proposed sensor; (b) cross-section of the stacked preform
Fig. 22. Schematic representation of developing a biosensor based on etched FBG for thrombin detection[59]
Fig. 23. Schematic diagram of the SPR-TFBG biosensor[60]
Fig. 24. DNA hybrid optical fiber sensor with temperature and pH compensation[61]
Fig. 25. Optical fiber biosensor based on ultra-narrow band cladding mode resonance[62]
Fig. 26. Gold nanoparticles enhance spectral responses of TFBG-SPR sensor for NA detection


Set citation alerts for the article
Please enter your email address

© Copyright 2018-2021 | Chinese Laser Press. All Rights Reserved 沪ICP备15018463号-20