• Laser & Optoelectronics Progress
  • Vol. 60, Issue 13, 1314002 (2023)
Jianlin Chen and Xuyue Wang*
Author Affiliations
  • School of Mechanical Engineering, Dalian University of Technology, Dalian 116024, Liaoning, China
  • show less
    DOI: 10.3788/LOP230576 Cite this Article Set citation alerts
    Jianlin Chen, Xuyue Wang. Analysis of Heat-Affected Zone and Optimization of Parameters for Laser-Cut Carbon Fiber Composites[J]. Laser & Optoelectronics Progress, 2023, 60(13): 1314002 Copy Citation Text show less
    Diagram of laser cutting CFRP
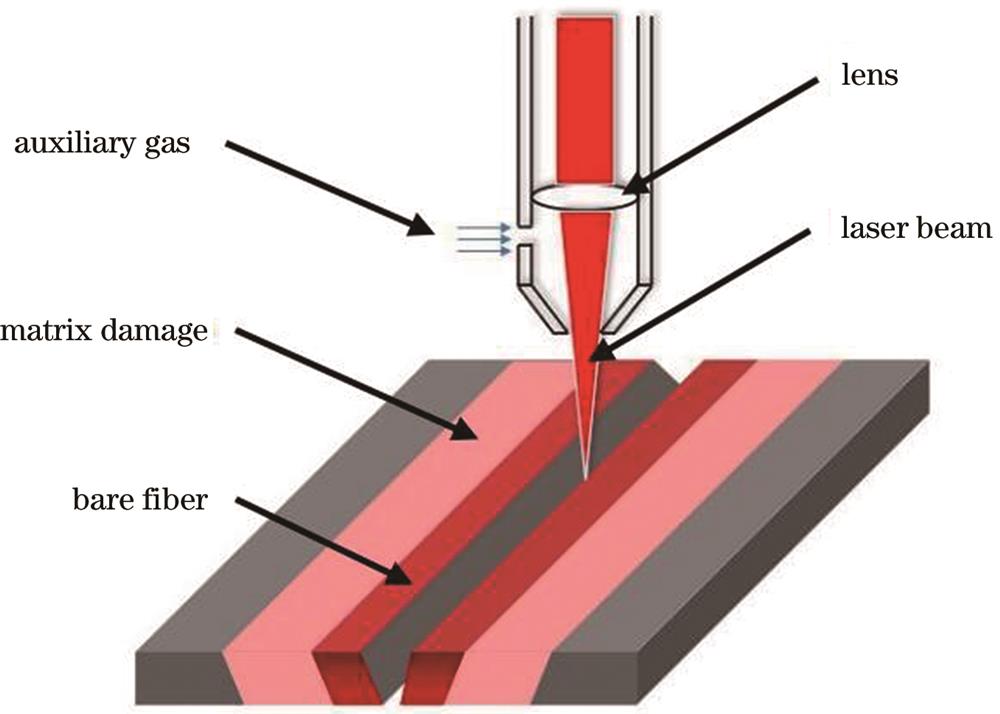
    Fig. 1. Diagram of laser cutting CFRP
    Laser cutting of CFRP morphology. (a) Global morphology; (b) bare fiber; (c) material layering
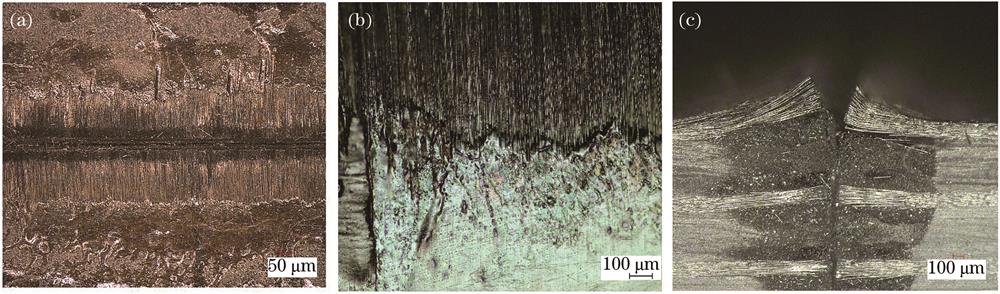
    Fig. 2. Laser cutting of CFRP morphology. (a) Global morphology; (b) bare fiber; (c) material layering
    Morphology of HAZ on the specimen surface under different powers. (a) 150 W; (b) 450 W; (c) 750 W
    Fig. 3. Morphology of HAZ on the specimen surface under different powers. (a) 150 W; (b) 450 W; (c) 750 W
    Morphology of HAZ on the specimen surface at different scanning speeds. (a) 1.5 m/min; (b) 2.75m /min; (c) 4 m/min
    Fig. 4. Morphology of HAZ on the specimen surface at different scanning speeds. (a) 1.5 m/min; (b) 2.75m /min; (c) 4 m/min
    Relationship between focus and artifact position
    Fig. 5. Relationship between focus and artifact position
    Morphology of HAZ on the specimen surface at different focal positions. (a)-2 mm; (b) 0 mm; (c) 2 mm
    Fig. 6. Morphology of HAZ on the specimen surface at different focal positions. (a)-2 mm; (b) 0 mm; (c) 2 mm
    Morphology of HAZ on the specimen surface under different air pressures. (a) 0 MPa; (b) 0.4 MPa; (c) 0.8 MPa
    Fig. 7. Morphology of HAZ on the specimen surface under different air pressures. (a) 0 MPa; (b) 0.4 MPa; (c) 0.8 MPa
    Morphology of the heat-affected zone of specimen cross section. (a) HAZmax on the top; (b) HAZmax on the inside; (c) HAZmax at the bottom
    Fig. 8. Morphology of the heat-affected zone of specimen cross section. (a) HAZmax on the top; (b) HAZmax on the inside; (c) HAZmax at the bottom
    Morphology of HAZ of the specimen cut section. (a) Fiber pulling out; (b) holes and cracks; (c) fibrous adhesion
    Fig. 9. Morphology of HAZ of the specimen cut section. (a) Fiber pulling out; (b) holes and cracks; (c) fibrous adhesion
    Model summary
    Fig. 10. Model summary
    Pareto diagram of the standardization effect
    Fig. 11. Pareto diagram of the standardization effect
    Response surface diagram. (a) Effect of power and velocity interaction on HAZ; (b) effect of power and gas pressure interaction on HAZ; (c) effect of power and focus position interaction on HAZ; (d) effect of velocity and gas pressure interaction on HAZ; (e) effect of velocity and focus position interaction on HAZ; (f) effect of gas pressure and focus position interaction on HAZ
    Fig. 12. Response surface diagram. (a) Effect of power and velocity interaction on HAZ; (b) effect of power and gas pressure interaction on HAZ; (c) effect of power and focus position interaction on HAZ; (d) effect of velocity and gas pressure interaction on HAZ; (e) effect of velocity and focus position interaction on HAZ; (f) effect of gas pressure and focus position interaction on HAZ
    ParameterFiberMatrix
    Density /(g·cm-31.761.30
    Thermal conductivity /(W·m-1·K-184(axial),8.4(radial)0.2
    Specific heat capacity /(J·kg-1·K-17951200
    Coefficient of linear expansion /(10-6 K-1-0.4157
    Table 1. CRRP material parameters
    FactorLow-levelCentral pointHigh level
    Power /W150450750
    Speed /(m·min-11.52.754
    Nitrogen pressure /MPa0.40.50.6
    Focal position /mm-202
    Table 2. Box-Behnken test factor levels
    Standard sequenceRunning sequencePowerSpeedGas pressureFocal position
    2714502.750.50
    1624504.000.60
    1837502.750.40
    1941502.750.60
    351504.000.50
    467504.000.50
    2077502.750.60
    2284504.000.5-2
    1791502.750.40
    21104501.500.5-2
    7114502.750.42
    24124504.000.52
    12137502.750.52
    5144502.750.4-2
    14154504.000.40
    13164501.500.40
    26174502.750.50
    25184502.750.50
    23194501.500.52
    10207502.750.5-2
    2217501.500.50
    15224501.500.60
    1231501.500.50
    6244502.750.6-2
    11251502.750.52
    9261502.750.5-2
    8274502.750.62
    Table 3. Box-Behnken test table
    SourceAdjssAdjmsFP
    Model10496107497232.950.000
    Linearity78995619748986.800.000
    Power665862665862292.650.000
    Speed11245611245649.430.000
    Pressure110611060.490.499
    Focal position10532105324.630.053
    Square term2508396271027.560.000
    Power×power923659236540.600.000
    Speed×speed557805578024.520.000
    Pressure×pressure268672686711.810.005
    Focal position×focal position362013620115.910.002
    Error273032275--
    Misfit2666426668.340.112
    Pure error639320--
    Total1076914---
    Table 4. Variance analysis of heat-affected zone width
    Power /WSpeed /(m·min-1Pressure /MPaFocal position /mmActual value /μmFitting value /μmRelative error /%
    1501.500.50514.50488.315.1
    4502.750.50887.39850.544.2
    7504.000.50801.18765.824.4
    Table 5. Comparison of test and fitting values for the width of the heat-affected zone
    Jianlin Chen, Xuyue Wang. Analysis of Heat-Affected Zone and Optimization of Parameters for Laser-Cut Carbon Fiber Composites[J]. Laser & Optoelectronics Progress, 2023, 60(13): 1314002
    Download Citation