• Remote Sensing Technology and Application
  • Vol. 39, Issue 1, 248 (2024)
Nile WU1,2,*, Yulong BAO1,2, Rentuya BU3, Buxinbayaer TU1,2..., Saixiyalatu TAO3, Yuhai BAO1,2 and Eerdemutu JIN1,2|Show fewer author(s)
Author Affiliations
  • 1School of Geographical Sciences,Inner Mongolia Normal University,Hohhot 010022,China
  • 2Inner Mongolia Autonomous Region Key Laboratory of Remote Sensing and Geographic Information System,Hohhot 010022,China
  • 3Environmental Monitoring Station of Inner Mongolia Autonomous Region,Hohhot 010011,China
  • show less
    DOI: 10.11873/j.issn.1004-0323.2024.1.0248 Cite this Article
    Nile WU, Yulong BAO, Rentuya BU, Buxinbayaer TU, Saixiyalatu TAO, Yuhai BAO, Eerdemutu JIN. Identification of Typical Grassland Degradation Indicator Species based on UAV Hyperspectral Remote Sensing[J]. Remote Sensing Technology and Application, 2024, 39(1): 248 Copy Citation Text show less
    Geographical location of the study area
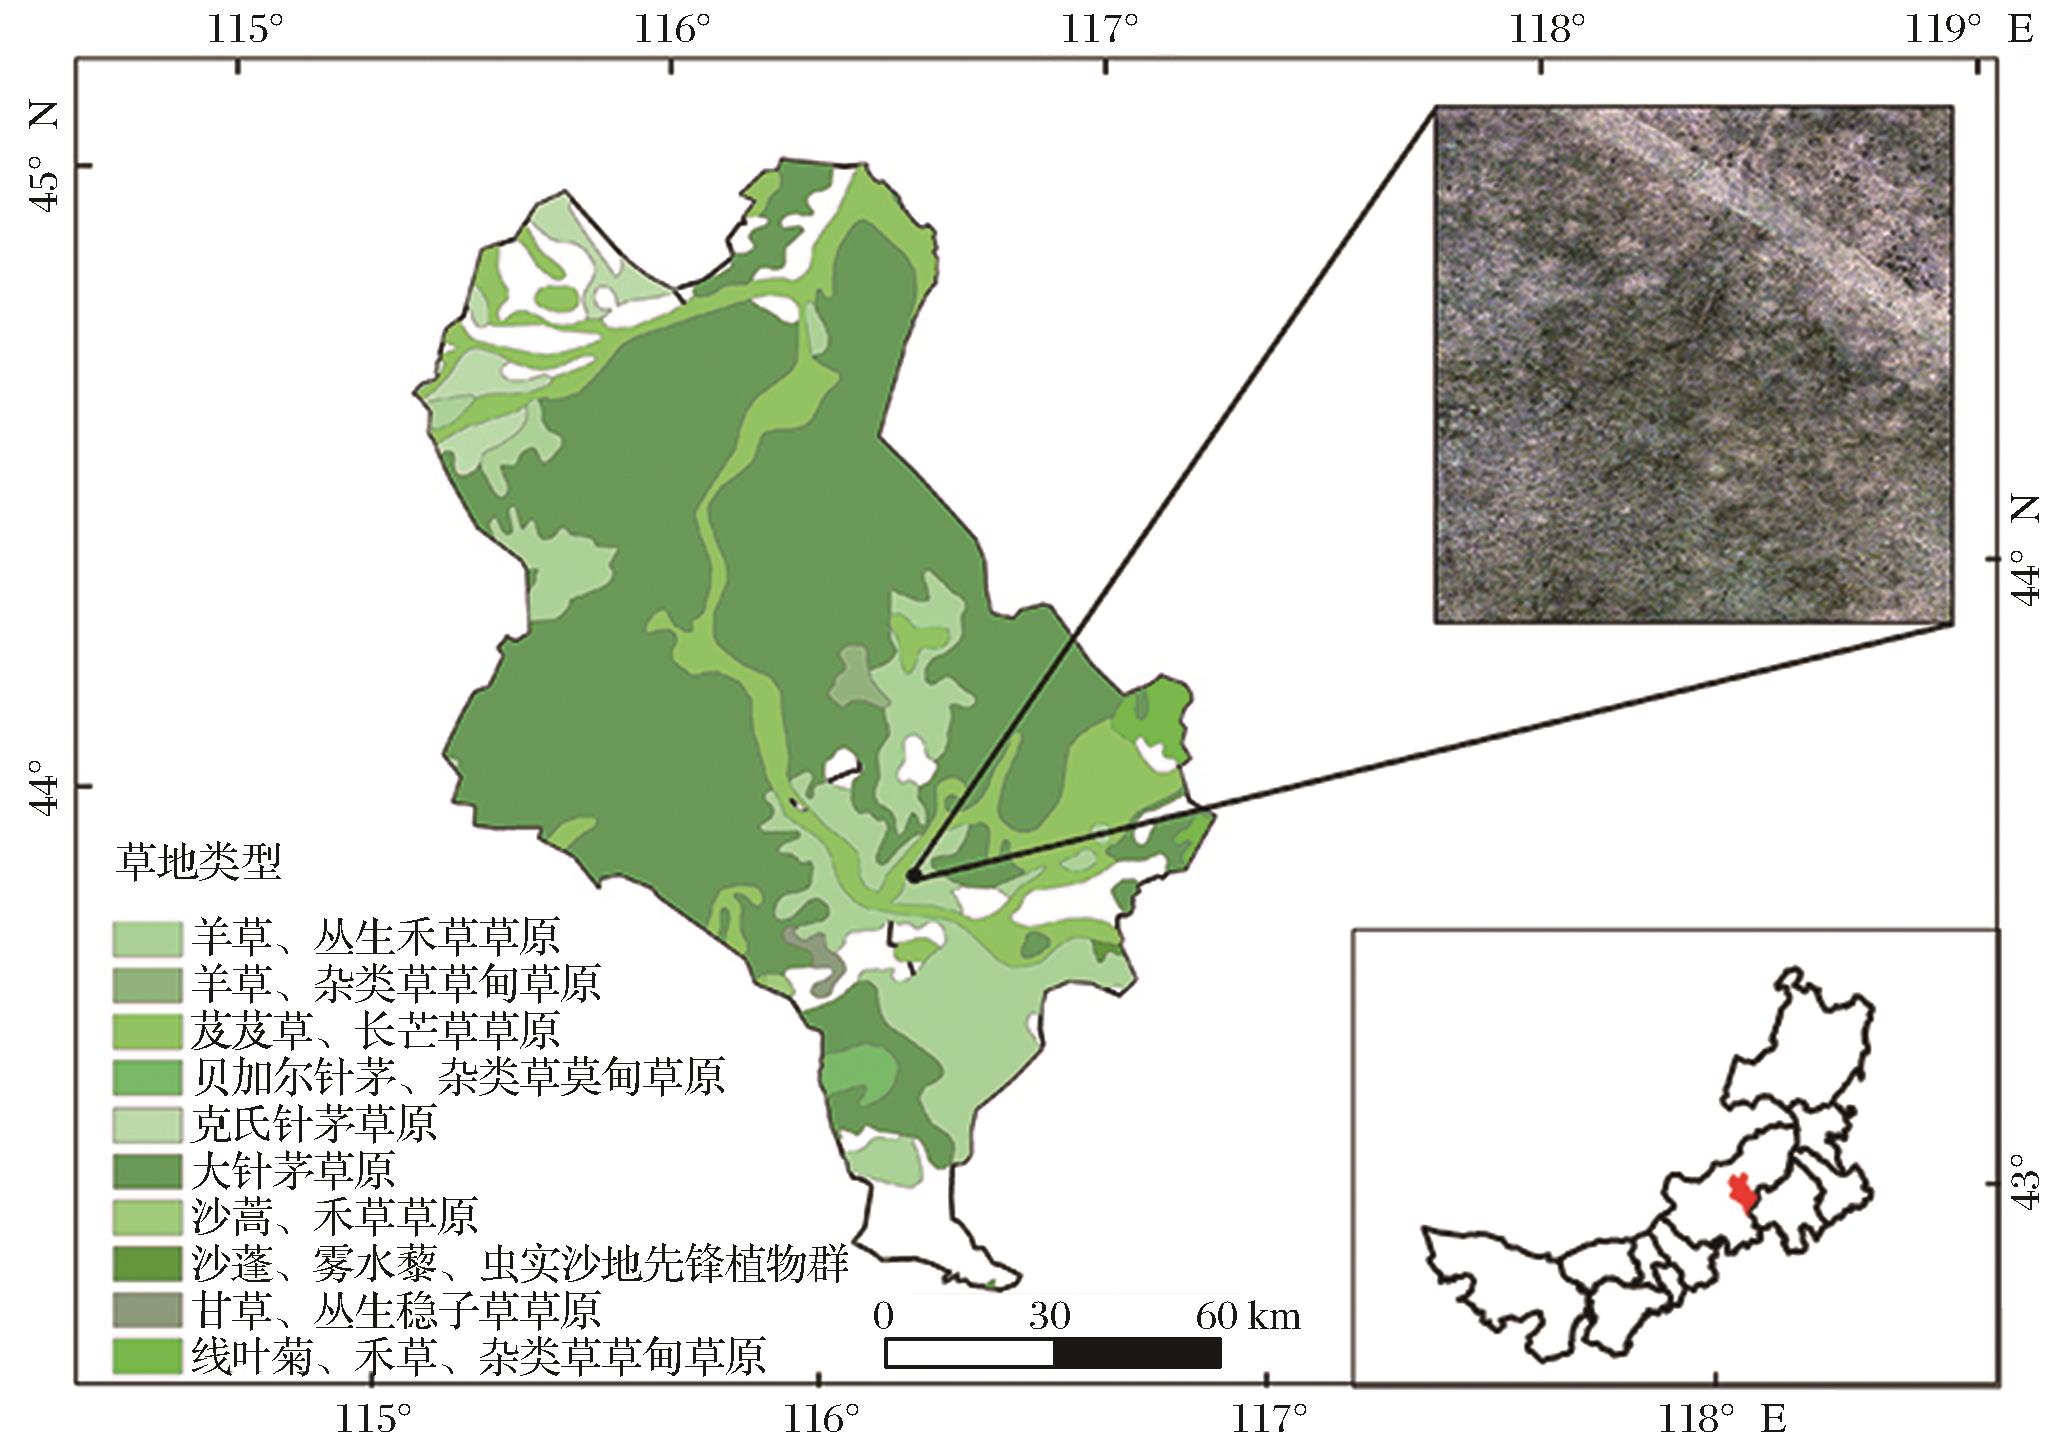
    Fig. 1. Geographical location of the study area
    UAV and hyperspectral remote sensing image acquisition systems
    Fig. 2. UAV and hyperspectral remote sensing image acquisition systems
    Vegetation photos of the study area and ground data collection site photos
    Fig. 3. Vegetation photos of the study area and ground data collection site photos
    Comparison of the original spectral curve and the spectral curve after smoothing noise reduction
    Fig. 4. Comparison of the original spectral curve and the spectral curve after smoothing noise reduction
    Measured reflection spectral curve
    Fig. 5. Measured reflection spectral curve
    Differential transformation curve diagram
    Fig. 6. Differential transformation curve diagram
    Envelope removal transform spectrum curve
    Fig. 7. Envelope removal transform spectrum curve
    Spectral characteristic curves and standard deviations of training samples
    Fig. 8. Spectral characteristic curves and standard deviations of training samples
    Training sample distribution plot
    Fig. 9. Training sample distribution plot
    Support Vector Machines and Random Forest classification results
    Fig. 10. Support Vector Machines and Random Forest classification results
    必须监测项目草原退化程度分级
    未退化轻度退化中度退化重度退化
    植物群落特征

    总覆盖度相对百分数的减少率/%

    草层高度相对百分比的降低率/%

    0~10

    0~10

    11~20

    11~20

    21~30

    21~50

    >30

    >50

    群落植物结构

    优势种牧草综合算术优势度相对百分数的增加率/%

    可食草种个种数相对百分数的减少率/%

    不可食草与毒害草个体数相对百分数的增加率/%

    0~10

    0~10

    0~10

    11~20

    11~20

    11~20

    21~40

    21~40

    21~40

    >40

    >40

    >40

    指示植物

    草地退化指示植物种个数相对百分数的增加率/%

    草地沙化指示植物种个体数相对百分数的增加率/%

    草地盐渍化指示植物种个体数相对百分数的增加率/%

    0~10

    0~10

    0~10

    11~20

    11~20

    11~20

    21~30

    21~30

    21~30

    >30

    >30

    >30

    Table 1. Classification and index of grassland degradation degree
    类型冷蒿裸土其他绿色植被总和总体精度Kappa
    冷蒿405574170.970
    裸土636803740.980
    其他绿色植被1903914100.950
    总和4303733981 20100
    总体精度0.940.990.9800.970
    Kappa000000.95
    Table 2. Confusion matrix result statistics table of Support Vector Machine
    类型冷蒿裸土其他绿色植被总和总体精度Kappa
    冷蒿409654200.970
    裸土536703720.990
    其他绿色植被1603934090.960
    总和4303733981 20100
    总体精度0.950.980.9900.970
    Kappa000000.96
    Table 3. Statistical table of confusion matrix results for Random Forest
    类型像元数研究区总像元百分比
    冷蒿36 088 64663 522 35356.8%
    裸土2 335 57663 522 3533.7%
    其他绿色植被25 098 13163 522 35339.5%
    Table 4. Pixel statistics table
    SPLITAI
    支持向量机3.645 395.071 3
    随机森林3.729 487.957 7
    Table 5. Landscape pattern index statistical table
    Nile WU, Yulong BAO, Rentuya BU, Buxinbayaer TU, Saixiyalatu TAO, Yuhai BAO, Eerdemutu JIN. Identification of Typical Grassland Degradation Indicator Species based on UAV Hyperspectral Remote Sensing[J]. Remote Sensing Technology and Application, 2024, 39(1): 248
    Download Citation