• Journal of Atmospheric and Environmental Optics
  • Vol. 19, Issue 6, 636 (2024)
LIU Xinran1,*, SHI Xiaowen1, CHEN Chen2, NING Heshan2..., PANG Yiyou1, HUANG Zixuan1 and ZHENG Jun1|Show fewer author(s)
Author Affiliations
  • 1School of Environmental Science and Engineering, Nanjing University of Information Science & Technology,Nanjing 210044, China
  • 2Reading Academy, Nanjing University of Information Science &Technology, Nanjing 210044, China
  • show less
    DOI: 10.3969/j.issn.1673-6141.2024.06.003 Cite this Article
    Xinran LIU, Xiaowen SHI, Chen CHEN, Heshan NING, Yiyou PANG, Zixuan HUANG, Jun ZHENG. Determination of nitrate photolysis frequency inside flow tube reactor using NO2 actinometry[J]. Journal of Atmospheric and Environmental Optics, 2024, 19(6): 636 Copy Citation Text show less
    Schematic diagram of light intensity measurement experiment
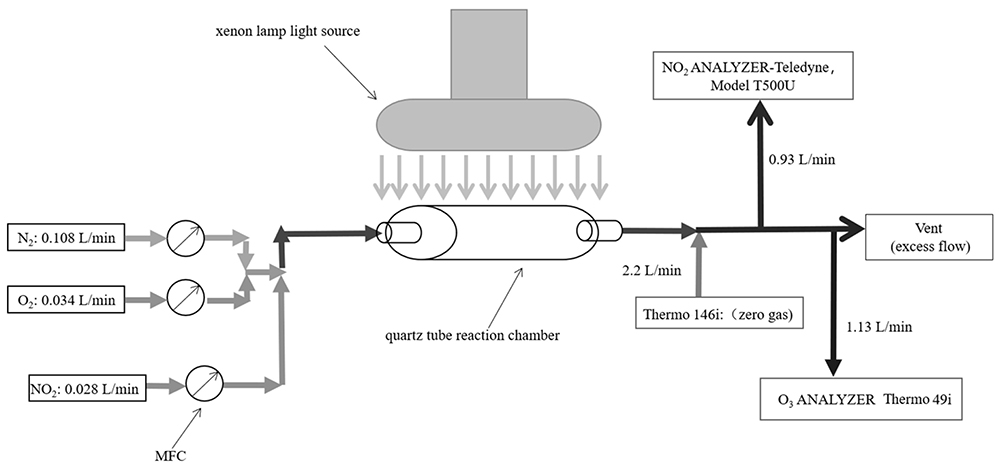
    Fig. 1. Schematic diagram of light intensity measurement experiment
    Schematic diagram of the cross-section of light intensity measurement experimental device
    Fig. 2. Schematic diagram of the cross-section of light intensity measurement experimental device
    Experimental process diagram of NO2 photolysis
    Fig. 3. Experimental process diagram of NO2 photolysis
    Change trend of O3 concentration simulated by MCM with time
    Fig. 4. Change trend of O3 concentration simulated by MCM with time
    Gas typeBackground concentration

    Before

    photolysis

    After

    photolysis

    Change in concentration
    NO2/(molecule·cm-3)5.90 × 10101.04 × 10138.60 × 10121.78 × 1012
    O3/(molecule·cm-3)2.94 × 10103.46 × 10101.71 × 10121.68 × 1012
    Table 1. Concentration changes of each product before and after photolysis reaction
    ReactionReaction rate constant/s-1
    NO2+hvNO+O6.78 × 10-3
            O2+OO31.34 × 10-14
    O3O2+O6 × 10-5
    NO+O3NO2+O21.95 × 10-14
    Table 2. Values of each reaction rate constant in MCM Model
    Research techniqueNO2 photolysis methodNitrate photometric method
    Measuring objectGaseous NO2Aqueous nitrate
    Experimental light source

    A xenon lamp (CEL-S500,

    500 W)

    A xenon lamp (CEAULIGHT, 300 W)
    Measuring mediaGasLiquid
    Principle of methodNO2 actinometry method

    The hydroxyl radical derived from nitrate photolysis was derived by

    benzoic acid to produce salicylic acid and its quantification was analyzed

    AdvantagesAvoid aqueous solution and physical configuration effectSimilar simulation of nitrate photolysis process
    Source of errorUncertain correlation between NO2 and HNO3Water weakening effect on light and anisotropy of light on different position
    Table 3. Comparison of the two methods for measuring irradiation intensity of light source
    Xinran LIU, Xiaowen SHI, Chen CHEN, Heshan NING, Yiyou PANG, Zixuan HUANG, Jun ZHENG. Determination of nitrate photolysis frequency inside flow tube reactor using NO2 actinometry[J]. Journal of Atmospheric and Environmental Optics, 2024, 19(6): 636
    Download Citation